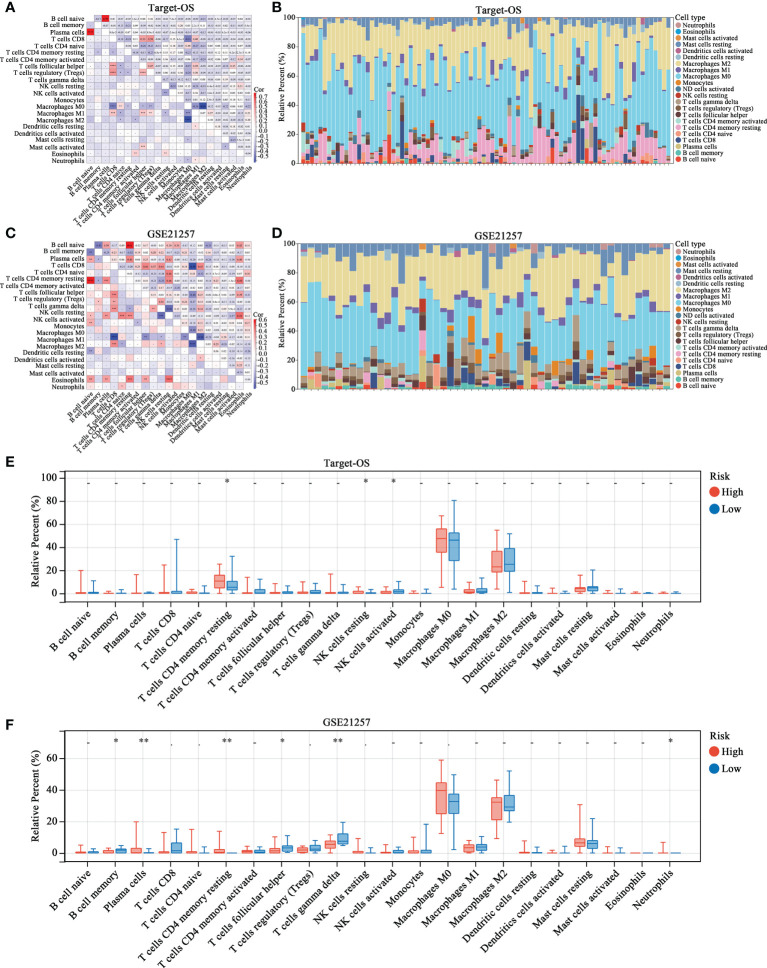
Figure 4.
The landscape of immune cell infiltration in high- and low-risk OS patients. (A–D) Correlation matrix and relative proportion of all 22 immune infiltration cell proportions based on CIBERSORT in the Target-OS (A, B) and GSE21257 (C, D) cohorts. (E, F) Boxplots visualize the differences of all 22 immune cells between the high- and low-risk groups. “*” represents P < 0.05 and “**” represents P < 0.01.

