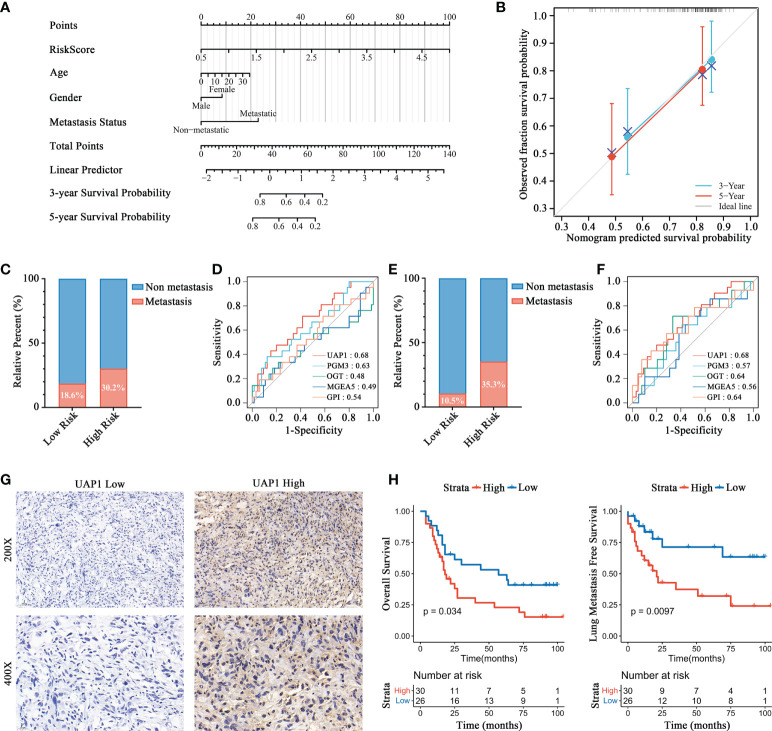
Figure 6.
Prognosis prediction validation of HBP-related risk model for OS patients. (A) Nomogram for predicting the probability of 3-, and 5-year overall survival for OS patients. (B) Calibration plot of the nomogram for predicting the probability of overall survival at 3-, and 5 years. (C, E) Distributions of patients with metastasis and non-metastasis between high- and low-risk groups in Target-OS (C) and GSE21257 (E) cohorts. (D, F) ROC curves for evaluating the predictive efficacy of HBP-related genes for metastasis in the Target-OS (D) and GSE21257 (F) cohorts. (G, H) Survival analysis showed a different survival portion between high and low UAP1 expression in osteosarcoma patients for overall survival (G) and lung metastasis free survival (H).

