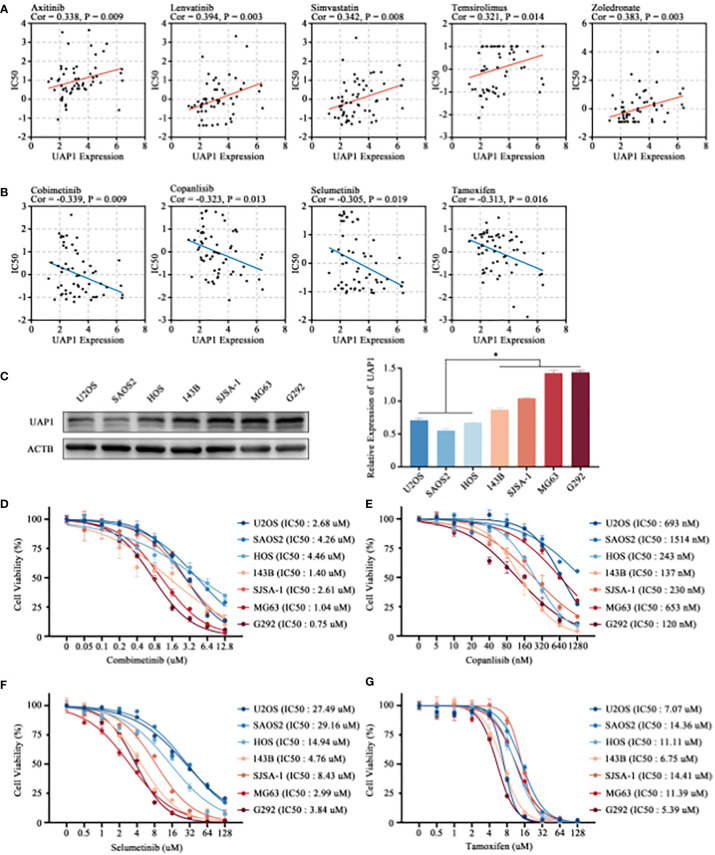
Figure 7.
Prediction of drug sensitivity targeting UAP1 and in-vitro cell verification. (A, B) Correlation analysis between the UAP1 expression and drug sensitivity in the NCI-60 cell lines. (C) The level of UAP1 protein expression in OS cell lines, as detected by western blotting. (D–G) IC50 of antineoplastic drugs including cobimetinib (D), copanlisib (E), selumetinib (F) and tamoxifen (G) in OS cell lines according to the CCK-8 assay. “*” represents P < 0.05.

