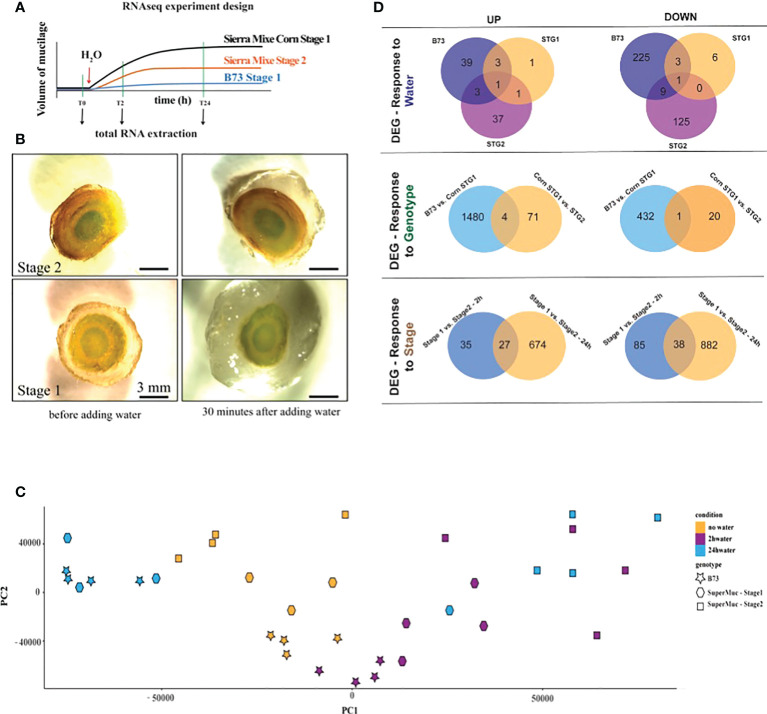
Figure 3.
RNAseq analysis was performed to understand maize aerial root’s response during mucilage production. (A) RNAseq experiment schematic representation. B73 aerial roots produce tiny amounts of mucilage. Stage 1 roots from maize accession Sierra Mixe produces more mucilage than stage 2. (B) Transversal sections of aerial roots in stages 1 and 2 before contact with water and 30 minutes after contact with water. (C) Principal component (PC) analysis plot displaying all 35 samples along PC1 and PC2. (D) Differentially regulated genes (DEG) were selected to respond to water, genotype, and stage. The Venn diagram summarizes the overlap and unique UP or DOWN regulated genes in the various conditions; upper panel B73, Stage 1, and Stage 2 overlap referring to before and after adding water; middle panel, overlap between genes regulated in B73 and those regulated in Stage 2 and lower panel, the overlap of genes in Stage 1 and Stage 2 at 2 and 24 hours after exposure to water. p-value < 0.05 and log(10) fold-change > 1.0.

