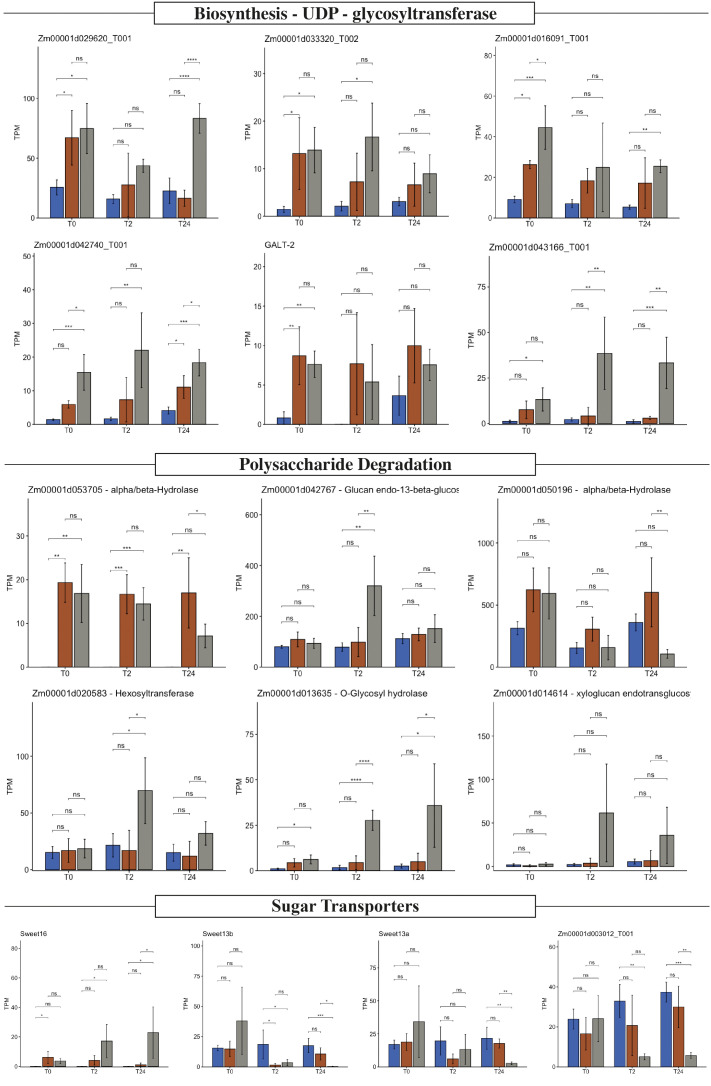
Figure 4.
Polysaccharide biosynthesis, degradation, and sugar transport expression profile. Expression value in transcripts per million (TPM) of six selected glycosyltransferases, six hydrolases, and four sugar transporters in Z. mays B73 (blue), Sierra Mixe (SM) stage 1 (orange), and Sierra Mixe stage 2 (gray) at zero (T0), two (T2), and twenty-four (T24) hours after adding water. Analysis of variance (ANOVA) was performed on TPM values and significance difference represents *p < 0.05; **p<0.01, ***p<0.001, ****p<0.0001. ns stands for non-significative.

