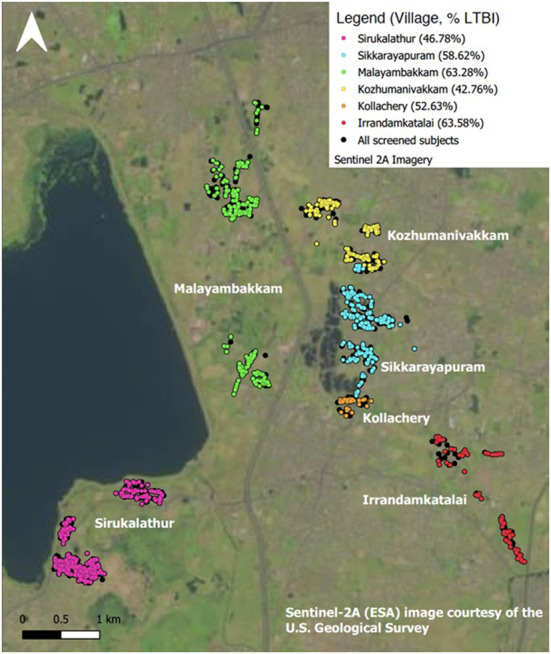
Figure 1.

Distribution of LTBI by study site. Map made in QGIS 3.10.11, study data displayed after processing in PostgreSQL and Pentaho. Contains information from OpenStreetMap and OpenStreetMap Foundation, which is made available under the Open Database License. OpenStreetMap data styled according to guidelines by https://github.com/charlesmillet.
