
Figure 1. Construct optimization and structures of HTR2B in different states.
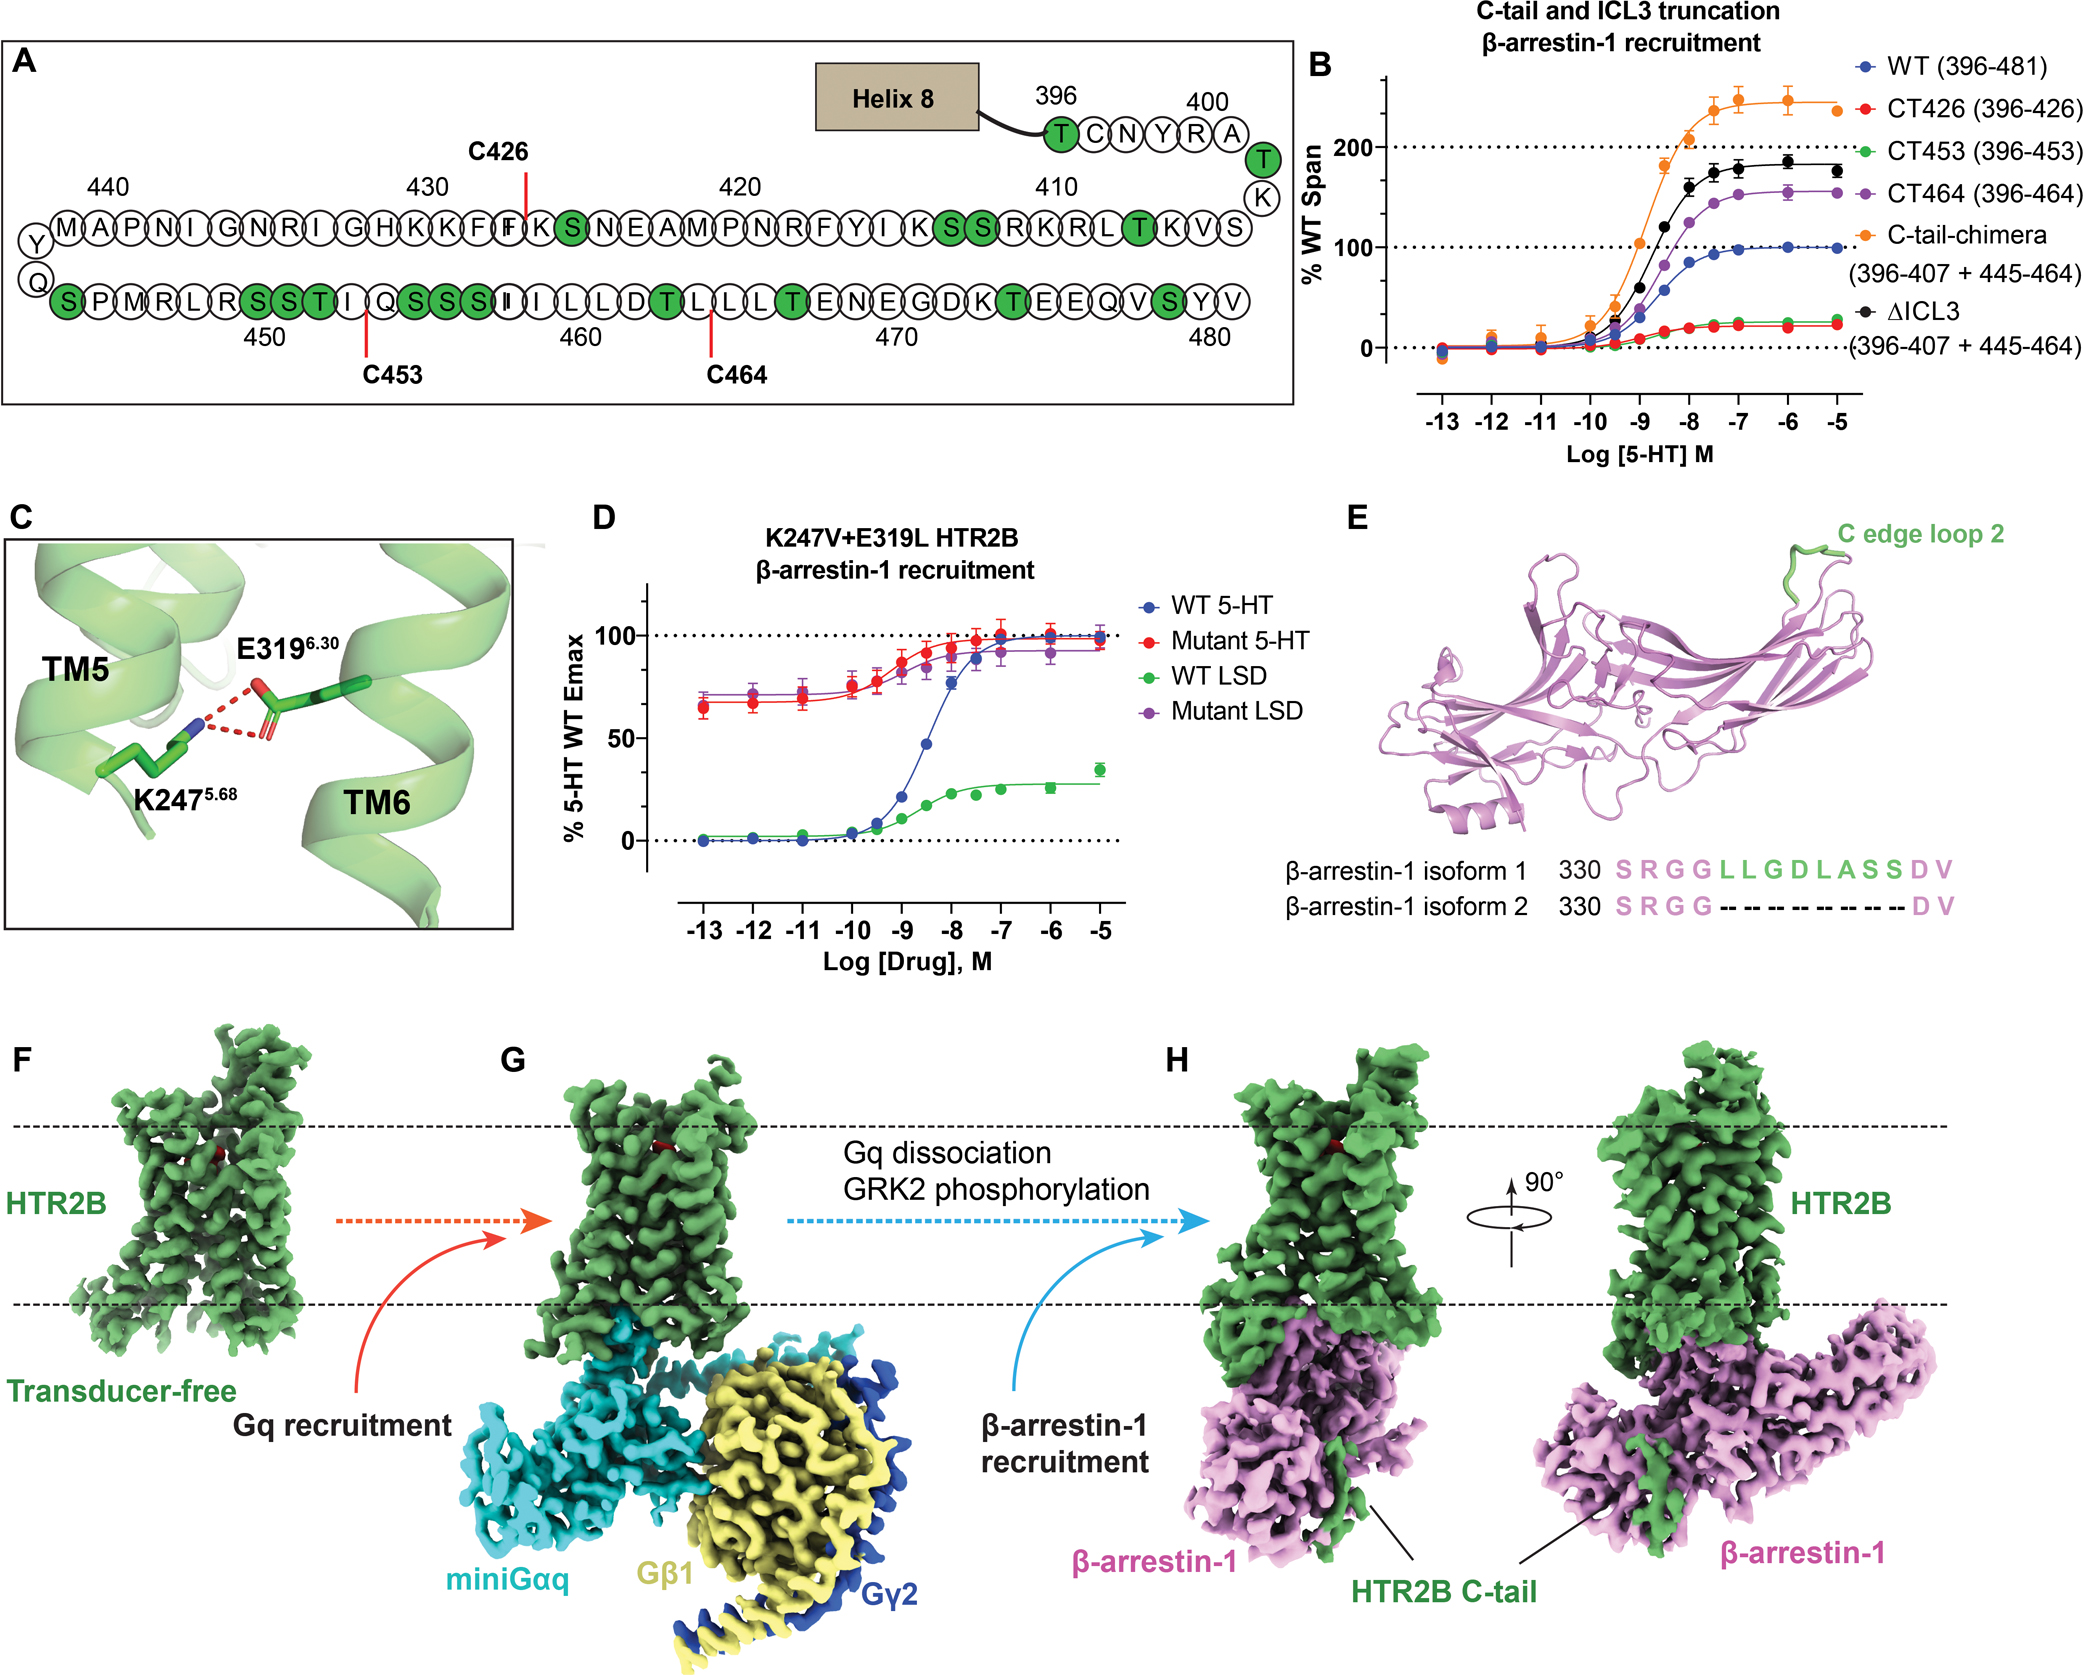
(A) The C-tail of HTR2B. Serines and threonines are highlighted by green circles. C-tail truncations C426, C453 and C464 are highlighted by red lines. See Figure S1. (B) β-arrestin-1 recruitment by different C-tail and ICL3 truncations HTR2B constructs. The remaining C-tail residues of each HTR2B truncation construct are shown in the brackets. Data represent mean ± SEM of n = 6 biological replicates. See Table S2 for fitted parameter values. (C) K2475.68 and E3196.30 form an ionic lock to restrict HTR2B (PDB 5TVN) in a partial active state. Hydrogen bonds are depicted as red dashed lines. (D) Breakage of K2475.68 and E3196.30 ionic lock by double mutations K2475.68V+E3196.30L greatly strengthened both the basal and LSD-stimulated β-arrestin-1 recruitment to a level comparable to the Emax of the full-agonist 5-HT. Data represent mean ± SEM of n = 4 biological replicates. See Table S3 for fitted parameter values. (E) Cartoon representation of β-arrestin-1 (PDB 4JQI) with the additional hydrophobic C loop 2 presented in the isoform 1 colored green. The sequence alignment of β-arrestins (residues 330–313) is also shown here to highlight the difference. (F-H) cryoEM maps of LSD-bound transducer-free (F), Gq-coupled (G) and β-arrestin-1 (H) coupled HTR2B. The maps are arranged in a sequential manner to highlight the signaling process of HTR2B. See Figures S1–S4 and Table S1 for details of protein expression and cryoEM data-processing.