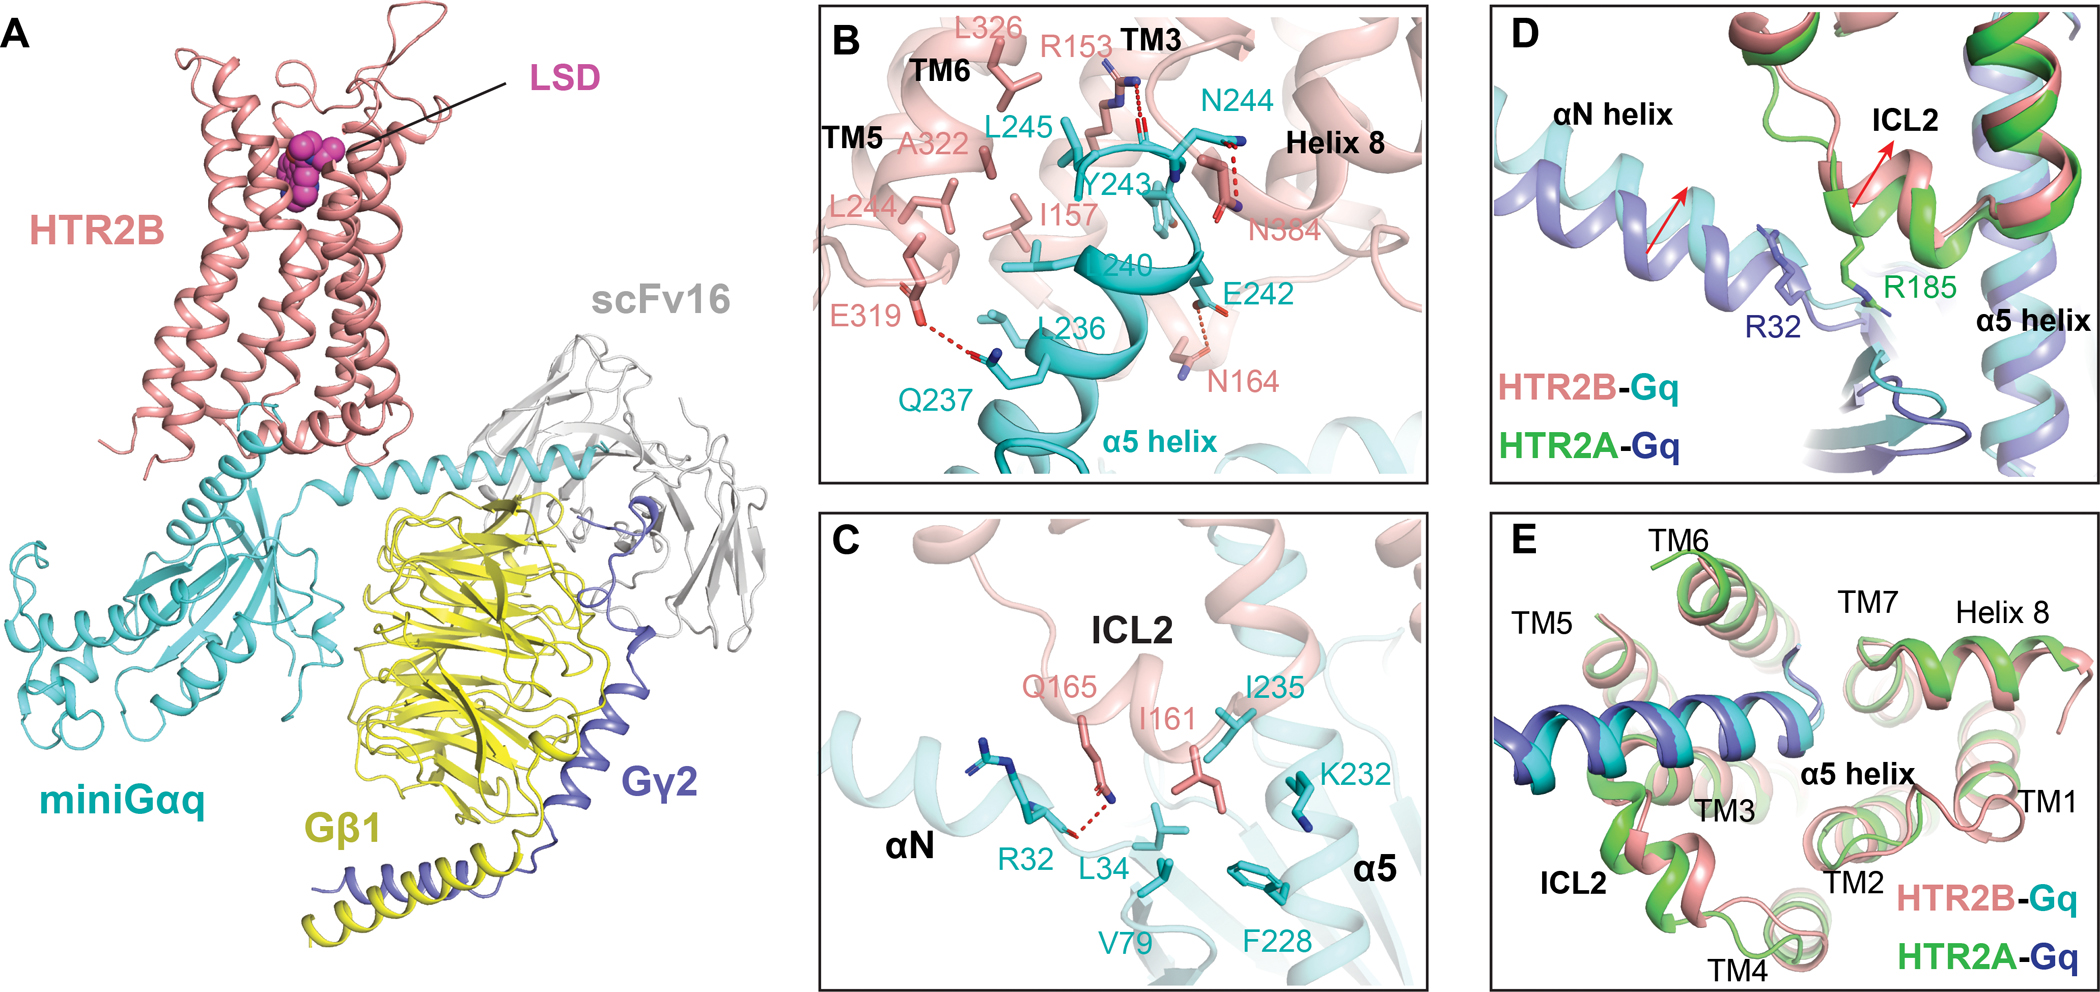
Figure 3. Gq engagement of HTR2B.

(A) The overall structure of HTR2B in complex with agonist LSD and miniGq. HTR2B and miniGq are coloured as red and cyan, respectively. (B) The interactions between the α5 helix of Gq and the cytoplasmic cavity of HTR2B. Key residues involved in interactions are shown as sticks. Polar interactions are highlighted by red dashed lines. (C) Interactions between the ICL2 of HTR2B and Gq, showing I16134.51 of HTR2B forms strong hydrophobic interactions with Gq. (D) Structural comparison of the HTR2B-Gq complex with HTR2A-Gq complex reveals inward displacements of both the ICL2 of HTR2B and the αN helix of Gq in HTR2B-Gq complex structure. (E) Structural comparison of the HTR2B-Gq complex with HTR2A-Gq complex reveals almost identical conformations of Gq α5 helix.
