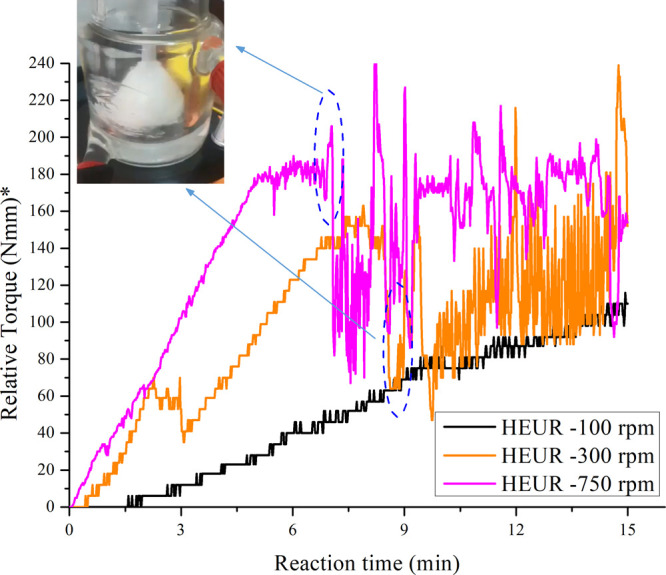
Figure 12.

Online torque recordings during polymerizations at different mixing speeds (100, 300, 750 rpm); the recorded signals at 300 and 750 rpm present a sharp drop, indicated on the graph. At this point, the bulk becomes a gel and crawled on the rod of the agitator, as seen in the photo inside the graph. *Relative torque refers to the difference in the actual torque value of the polymer relative to a baseline recording of pure PEG8000 at 80 °C.
