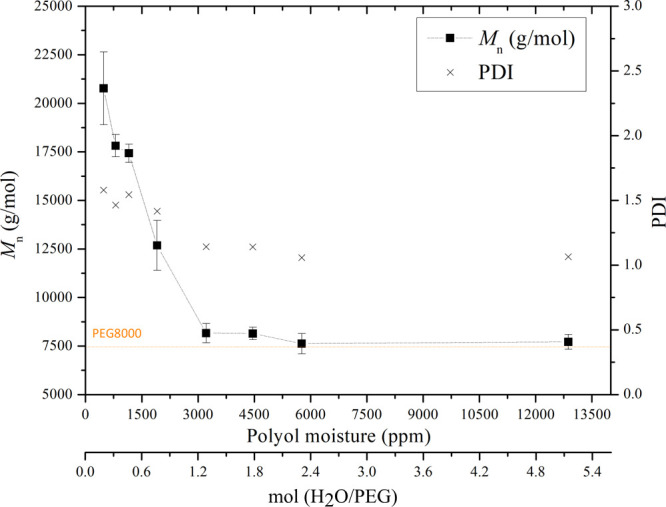
Figure 3.

Mn and PDI values of the produced HEURs obtained for various initial PEG moisture concentrations. The second x-axis shows the corresponding molar ratio (water/PEG). The measured Mn of the PEG8000 analyzed—as received—is also shown on the graph. The dashed lines have been added to guide the eye. Experiments were performed in at least three repetitions.
