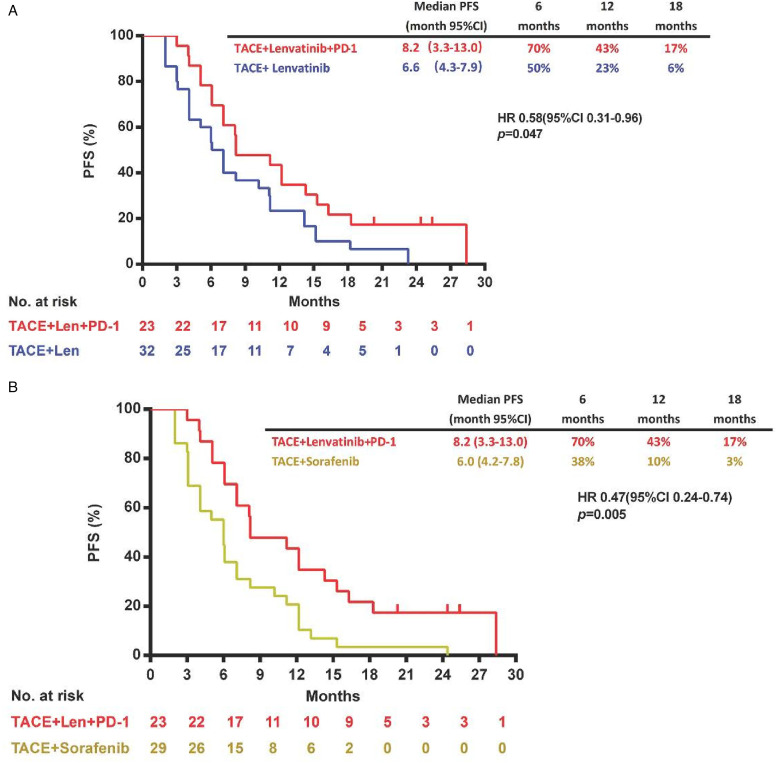
Figure 2.
Kaplan–Meier curves showing PFS of comparison of TACE plus lenvatinib and PD-1 inhibitor with TACE plus lenvatinib (A), and TACE plus lenvatinib and PD-1 inhibitor with TACE plus sorafenib (B).
Abbreviations: CI, confidence interval; HR, hazard ratio; PFS, progression-free survival; PD-1, programmed death 1; TACE, transarterial chemoembolization.

