
Figure 2.
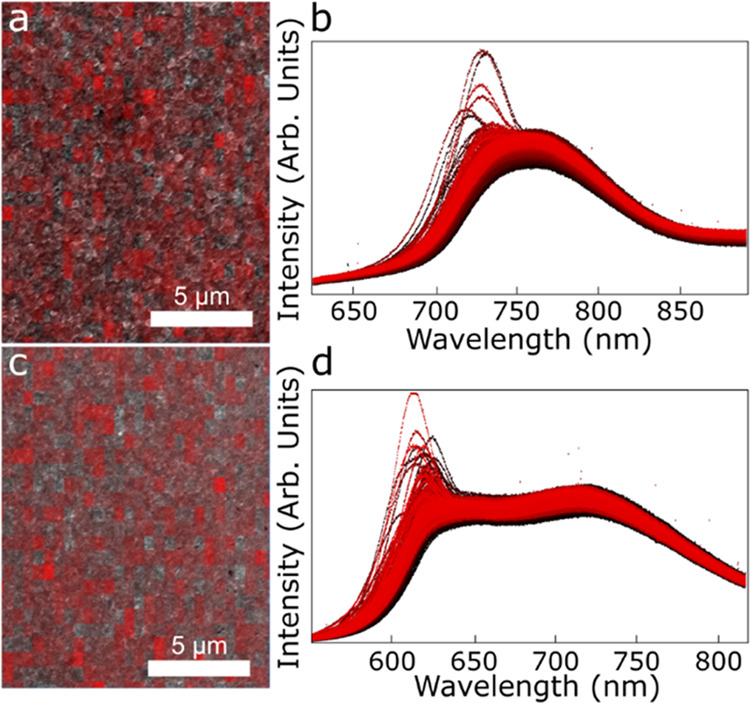
(a, c) Integrated intensity heat maps where darker red indicates higher intensity and (b, d) high-density CL spectra (702 spectra with 1024 points/spectra) of (a, b) Mg-435 and (c, d) Mg-450. Black to red coloring of the individual spectra (c, d) based on the spatial measurement location (starting with black at the top left of the map and ending with red at the bottom right) is added to provide contrast to each individual spectrum.