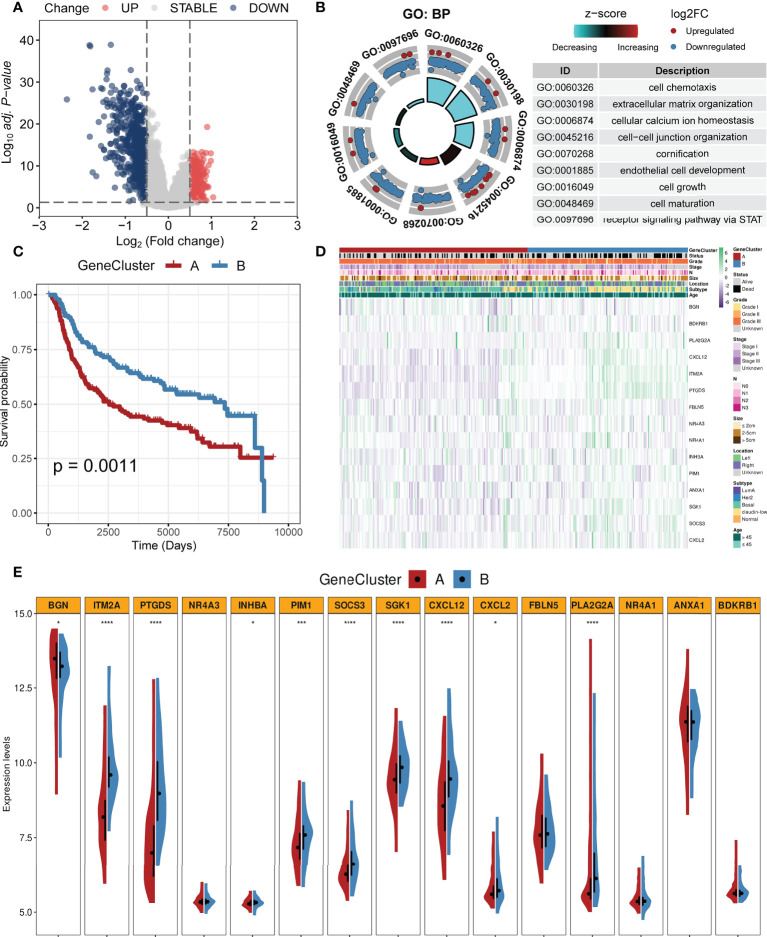
Figure 4.
Identification of gene clusters based on the DEGs. (A) Volcano plot of DEGs between two clusters (firebrick: upregulated; gray: not change; steel blue: downregulated). (B) GO enrichment analysis based on the DEGs. (C) K-M survival analysis of two gene clusters (firebrick: gene cluster A; steel blue: gene cluster B). (D) Heatmap of two gene clusters with clinical features. (E) Violin plots of the expression levels of CAF-related genes in two gene clusters (****, ***, and * mean p < 0.0001, < 0.001, and < 0.05, respectively).

