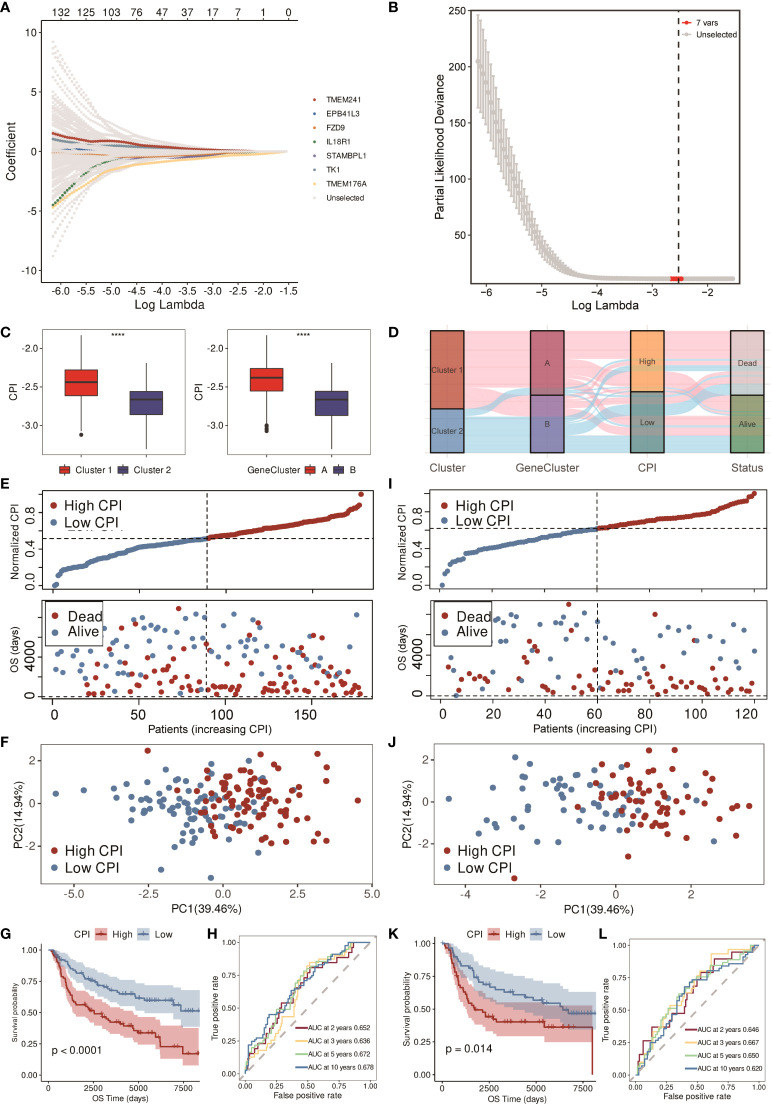
Figure 5.
Construction and validation of the CPI in the METABRIC cohort. (A) LASSO-Cox regression of the model genes. (B) Cross-validation for the LASSO-Cox regression. (C) Boxplots of the values of CPI between clusters and gene clusters (**** means p < 0.0001). (D) Alluvial diagram of the cluster, gene cluster, CPI group, and survival status. (E) Distribution of adjusted CPI and PCA plot based on the CPI groups in the METABRIC training cohort. (F) PCA plot in the METABRIC training cohort. (G) K-M survival analysis of the patients in the METABRIC training cohort (firebrick: high CPI; steel blue: low CPI). (H) ROC curve analysis according to the 2-, 3-, 5-, and 10-year survival of the AUC value in the METABRIC training cohort. (I) Distribution of adjusted CPI and PCA plot based on the CPI groups in the METABRIC validation cohort. (J) PCA plot in the METABRIC validation cohort. (K) K-M survival analysis of the patients in the METABRIC validation cohort (firebrick: high CPI; steel blue: low CPI). (L) ROC curve analysis according to the 2-, 3-, 5-, and 10-year survival of the AUC value in the METABRIC validation cohort.

