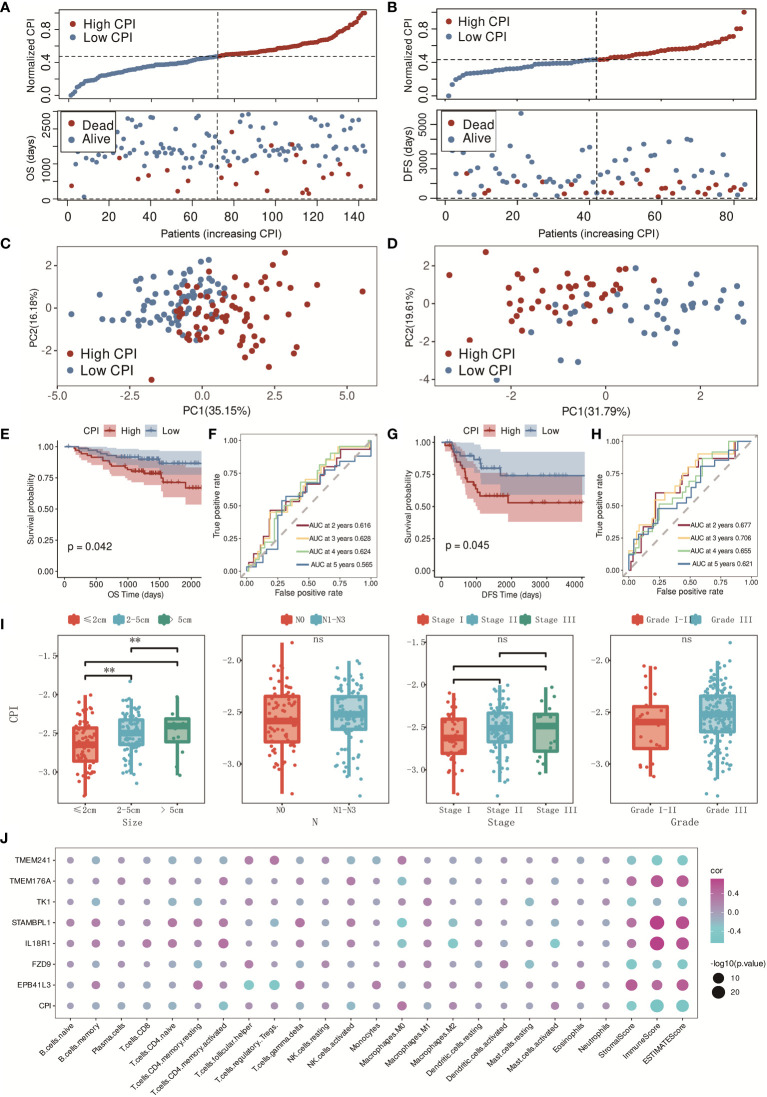
Figure 6.
Validation of the CPI in GSE96058 and GSE21653 cohorts. (A) Distribution of adjusted CPI based on the CPI groups in the GSE96058 validation cohort. (B) Distribution of adjusted CPI based on the CPI groups in the GSE21653 validation cohort. (C) PCA plot in the GSE96058 validation cohort (firebrick: high CPI; steel blue: low CPI). (D) PCA plot in the GSE21653 validation cohort (firebrick: high CPI; steel blue: low CPI). (E) K-M survival analysis of the patients in the GSE96058 validation cohort (firebrick: high CPI; steel blue: low CPI). (F) ROC curve analysis according to the 2-, 3-, 4-, and 5-year survival of the AUC value in the GSE96058 validation cohort. (G) K-M survival analysis of the patients in the GSE21653 validation cohort (firebrick: high CPI; steel blue: low CPI). (H) ROC curve analysis according to the 2-, 3-, 4-, and 5-year survival of the AUC value in the GSE21653 validation cohort. (I) Relationships between CPI groups and clinical features (ns means no significance, and ** means p < 0.01). (J) Relationships between model genes, CPI, and TME characteristics (purple: positive correlation; blue: negative correlation).

