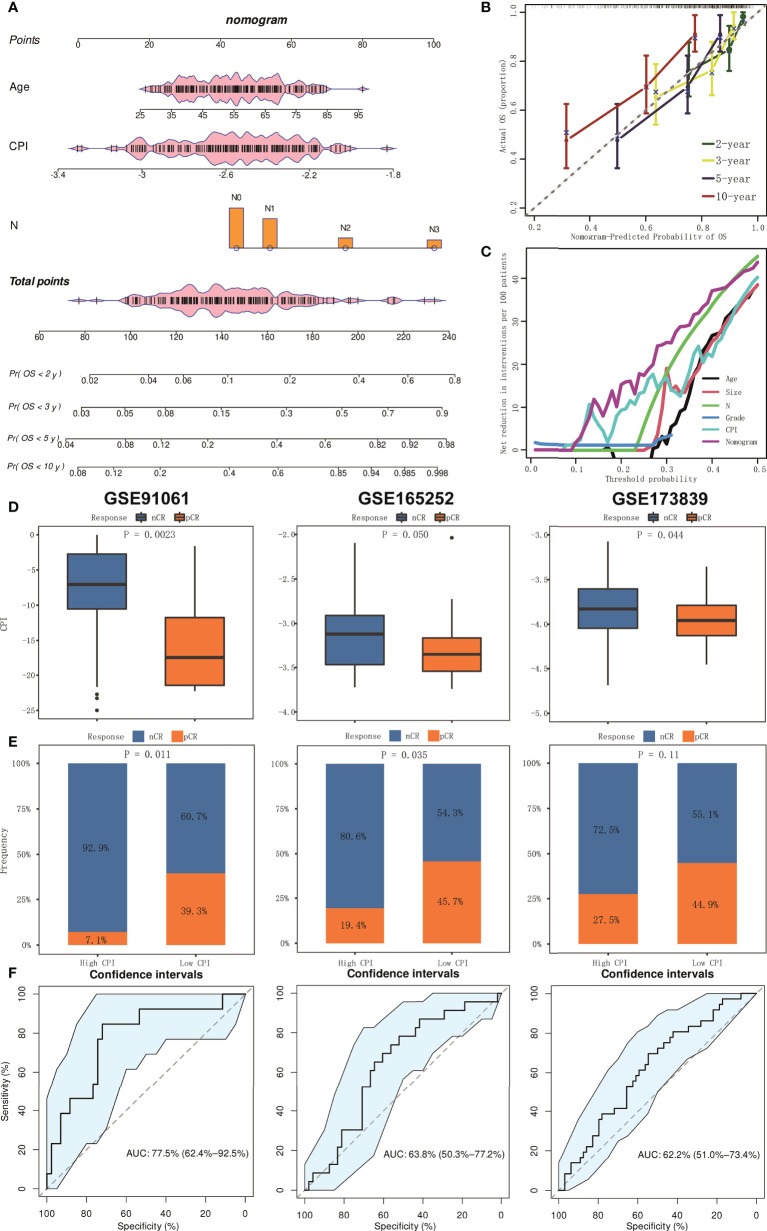
Figure 7.
The establishment and assessment of the nomogram and prediction of immunotherapy responsiveness. (A) Nomogram based on clinical features and CPI. (B) Calibration curves in predicting the 2-, 3-, 5-, and 10-year survival rate. (C) DCA of nomogram comparing age, tumor size, pathologic N, grade, and CPI. (D) Boxplots of the values of CPI between pCR and nCR groups in GSE91061, GSE165252, and GSE173938 cohorts. (E) Results of chi-square test between responsiveness and CPI groups in GSE91061, GSE165252, and GSE173938 cohorts. (F) ROC curve analysis of predicting the immunotherapy responsiveness in GSE91061, GSE165252, and GSE173938 cohorts.

