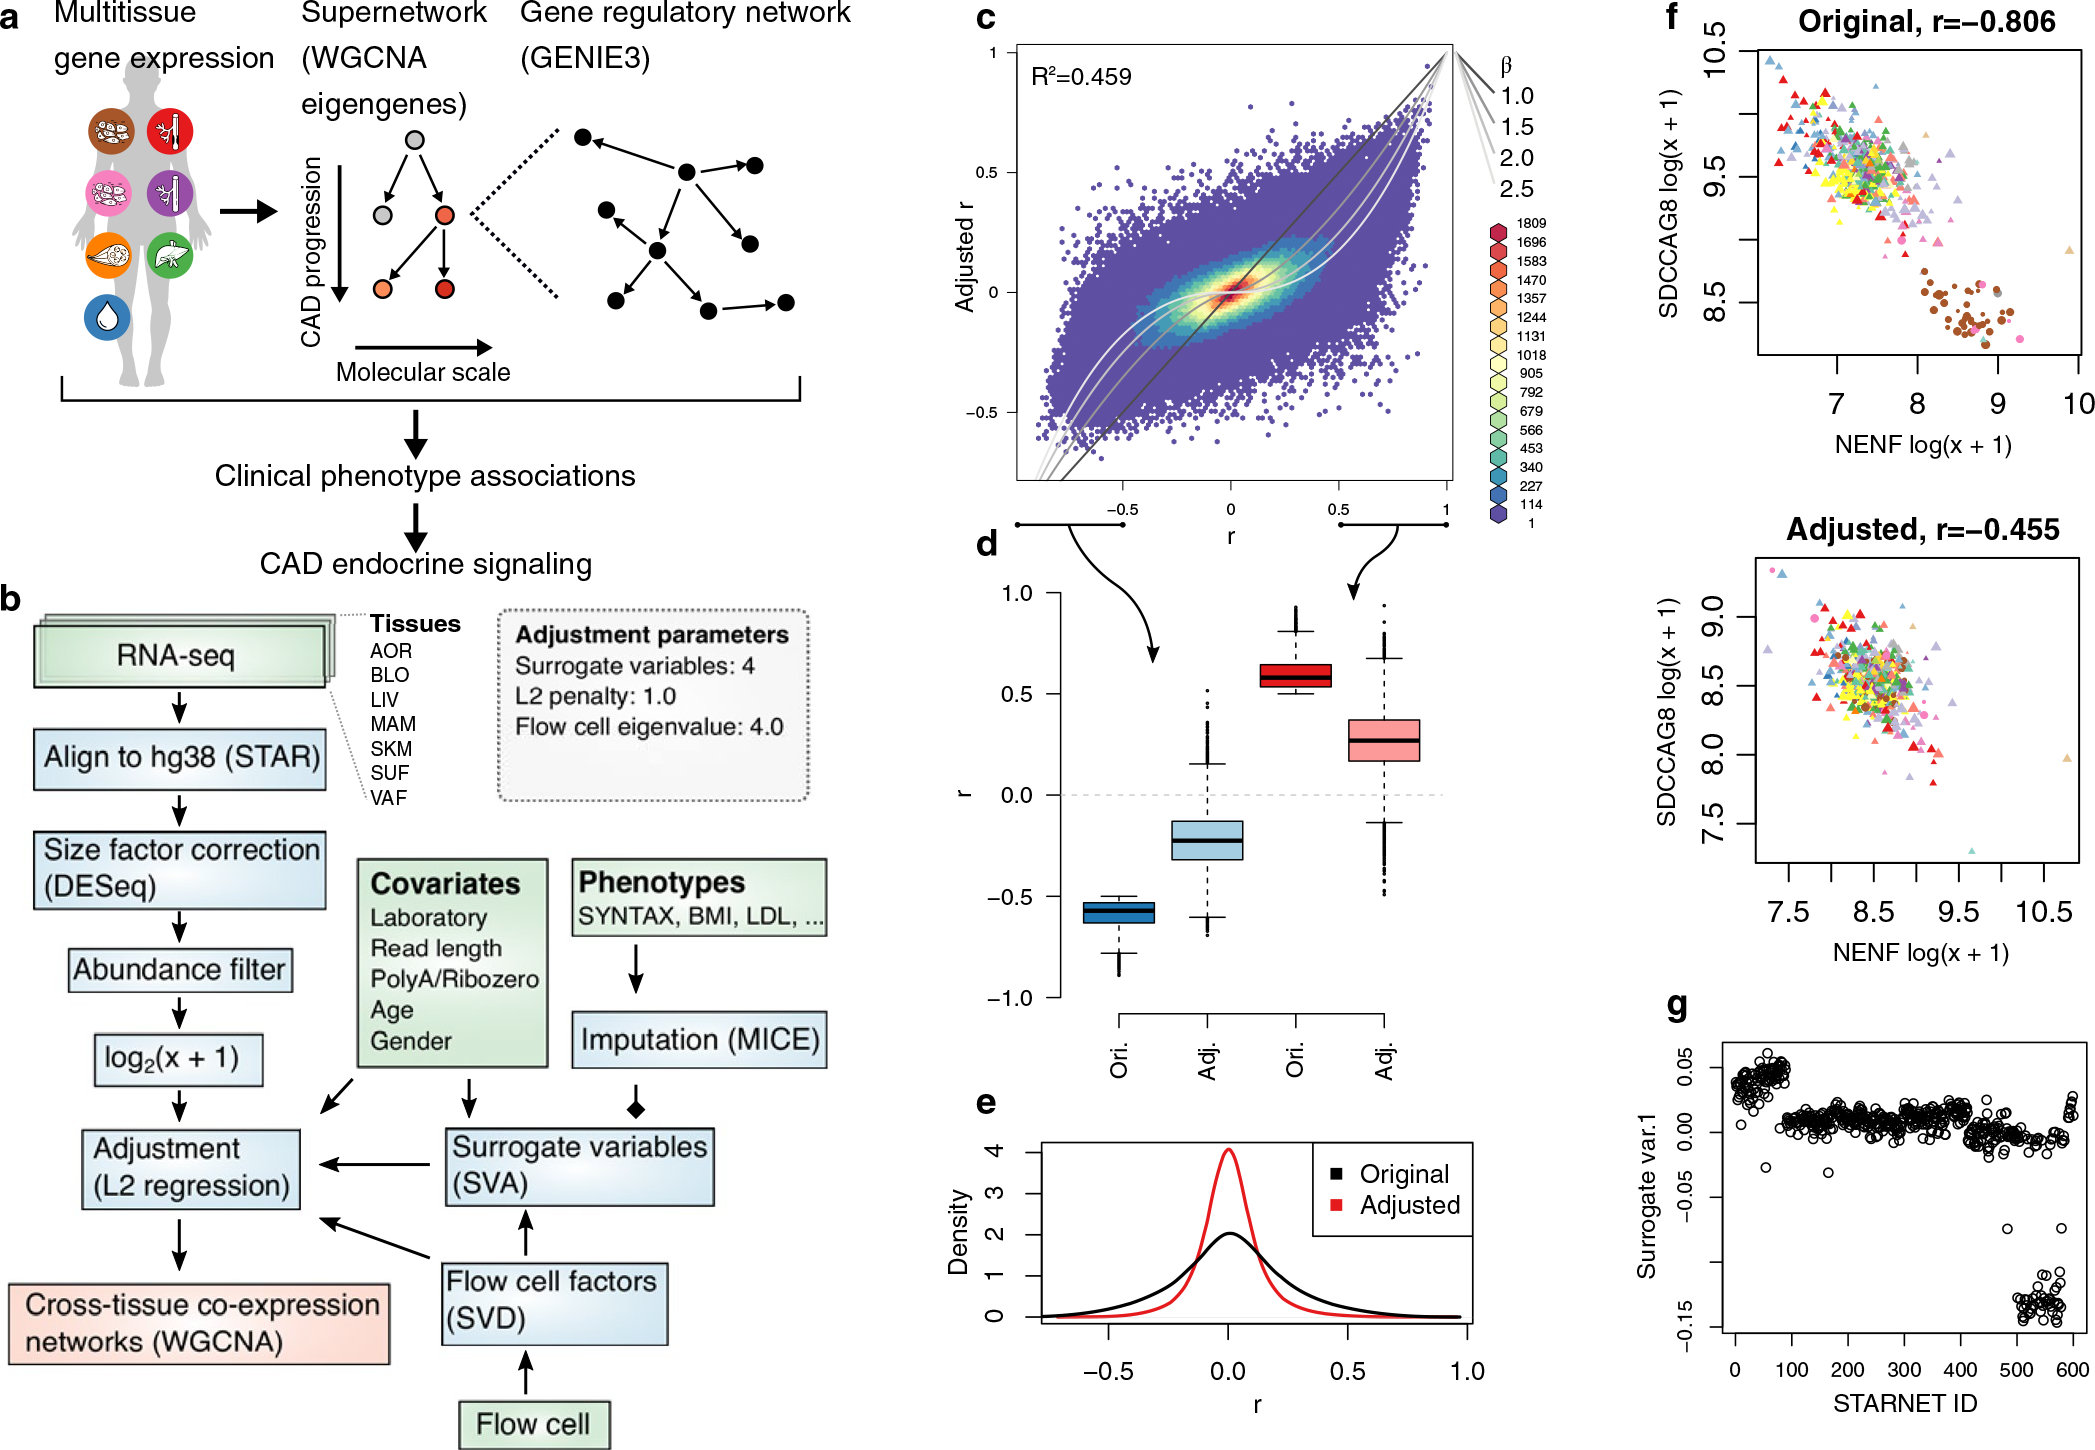
Extended Data Fig. 4 |. Schematics of the multiscale network modeling and normalization of RNA-seq data from the STARNET cases.

a, Schematic illustration of multiscale network modeling based on RNA-seq from multiple patient tissue samples. b, Analytic flow chart of the RNA-seq analysis. Green, blue and red boxes represent input data, steps of data normalization and network inferences, respectively (see also Methods). c, Typical effects of normalization on Pearson’s correlations between 1,000 randomly selected AOR transcripts. The grey lines indicate equivalence with different β-values used in WGCNA. d, Boxplots of n = 499,500 pairwise correlation coefficients among randomly selected genes. Median center, lower and upper quartile box, and 1.5 interquartile range whiskers. e, Density plots demonstrating the quenching effect on AOR transcript correlations following normalization. f, Representative example of the resolution of a partly spurious correlation most likely due to batch effects from different laboratory. The point shape corresponds to laboratory, colors to RNA-seq flow cell, and size to patient age. g, Surrogate variable used for adjustment that correlated to patient ID and not to other known covariates.
