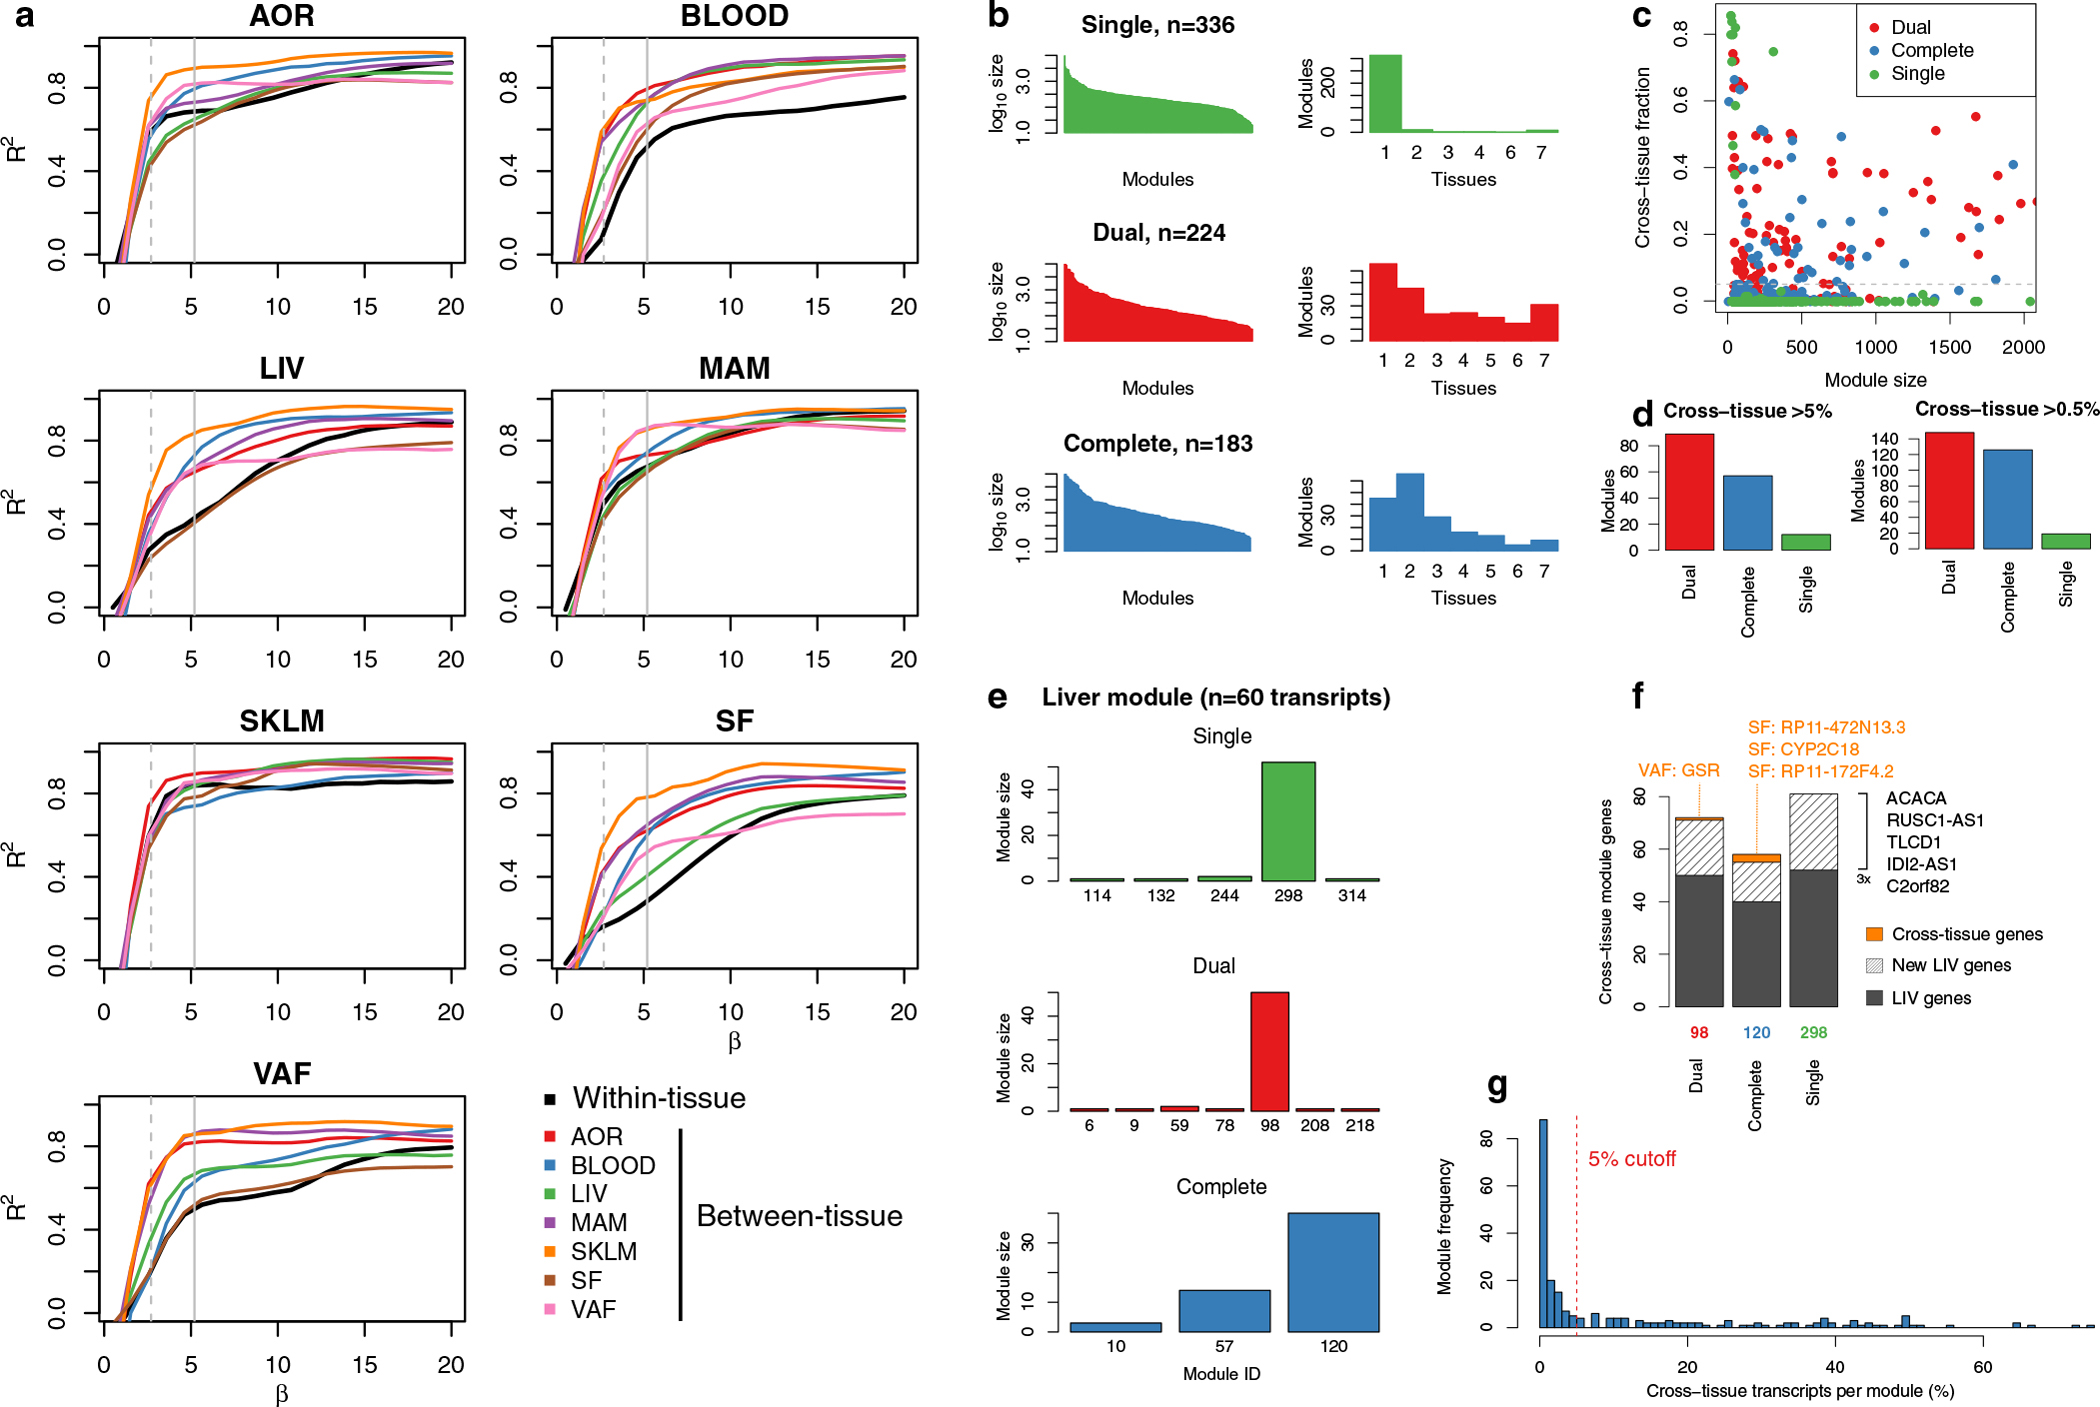
Extended Data Fig. 5 |. Optimization of scale-free properties of co-expression networks across tissues.

To achieve scale-free properties for both tissue-specific and cross-tissue co-expression networks using weighted gene co-expression network analysis (WGCNA), different β-values (exponentiation parameter of network weights) must be used for gene-gene interactions within and between tissues (Methods). a, β-value calibration curves per tissue and between all tissue combinations, showing the TOM-adjusted scale-free network properties of tissue-specific and cross-tissue networks at different β-values. b, The sizes of co-expression modules (left) and tissue specificity (right) detected using a single (upper panel, green), dual (middle, red) and complete set of pairwise β-values (lower, blue). WGCNA with a single, average β-value for all networks both within and across tissues resulted in 336 predominantly tissue-specific modules. A dual approach with two different β-values: average β-values for networks within tissues (the diagonal in panel c) and for networks across different tissues (off-diagonal β-values in panel c). This resulted in 224 co-expression modules whereof 158 contained genes in ≥2 tissues (70.5%). A complete use of the optimal β-value for each specific pair of tissues (β-values in panel c) resulted in 183 co-expression modules. c, Scatterplot showing the cross-tissue fraction of module transcripts at different module sizes (number of genes). The line indicates the 5% threshold used to define cross-tissue modules. d, Number of detected cross-tissue modules (y-axis) using single, dual and complete β values and the cross-tissue fraction thresholds of 5% (left) and 0.5% (right). e, Detection of a previously characterized and replicated liver-specific co-expression module10 identified from tissue-specific WGCNA of STARNET using a single (top, green), dual (middle, red) and complete (bottom, blue) β-values in the WGCNA across tissues. f, Overlapping genes with liver co-expression module for the most similar module inferred using single, dual and complete β-values with WGCNA across tissues. g, Frequency of co-expression modules with increasing numbers of cross-tissue genes.
