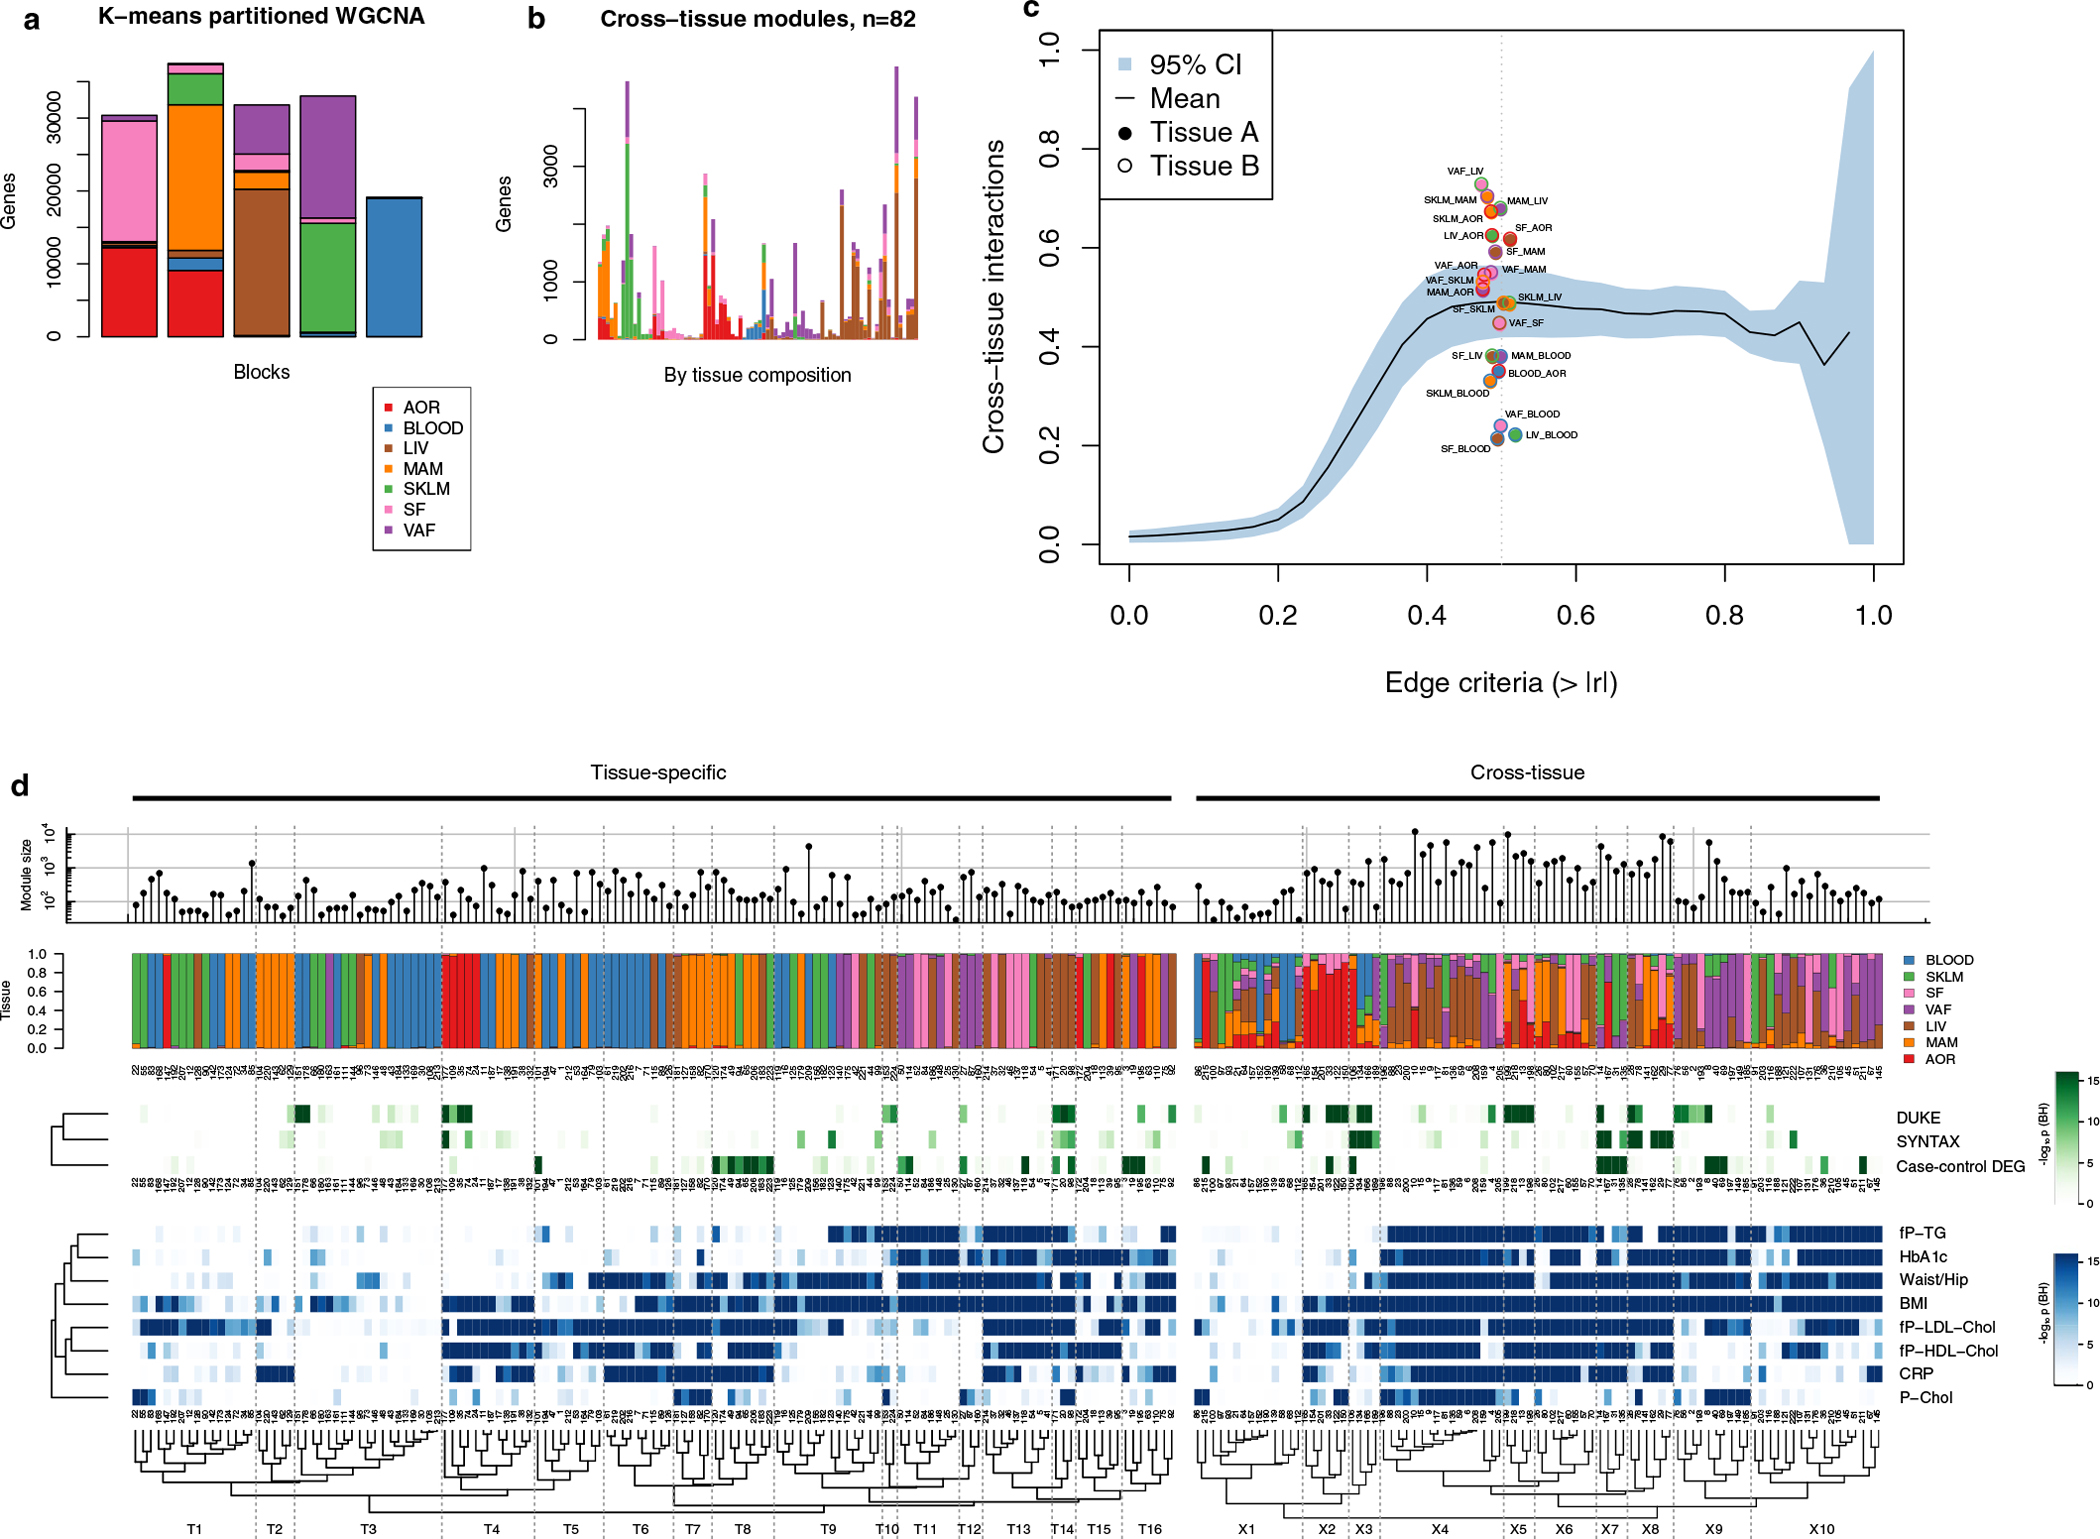
Extended Data Fig. 6 |. Cross-tissue co-expression module inference using block-wise WGCNA.

To accommodate the high number of transcripts quantified in the multitissue RNA-seq data, we used block-wise WGCNA, first partitioning transcripts from multiple tissues into 5 blocks using k-means. a, Barplot showing the tissue composition of transcripts segmented into 5 k-means clusters. b, Barplot showing hierarchical clustering of the tissue composition of cross-tissue co-expression modules detected with WGCNA. Each bar corresponds to one co-expression module. Y-axis shows the number of transcripts by tissue. Only modules containing <5,000 transcripts were included. c, Line plot showing the mean fraction of Pearson’s correlation coefficients (y-axis) captured in the 93 cross-tissue modules as a function of cross-tissue correlation cutoff criteria (x-axis). The means are calculated over the 21 tissue pairs in STARNET with the blue area indicating 95% confidence intervals. The vertical dotted line represents a correlation network edge criterium of 0.5, with all supporting tissues pairs plotted as points. d, Hierarchical clustering of co-expression modules, as shown in Fig. 2 d with module IDs.
