
Extended Data Fig. 9 |. Mendelian Randomization to determine gene-regulatory network causality.
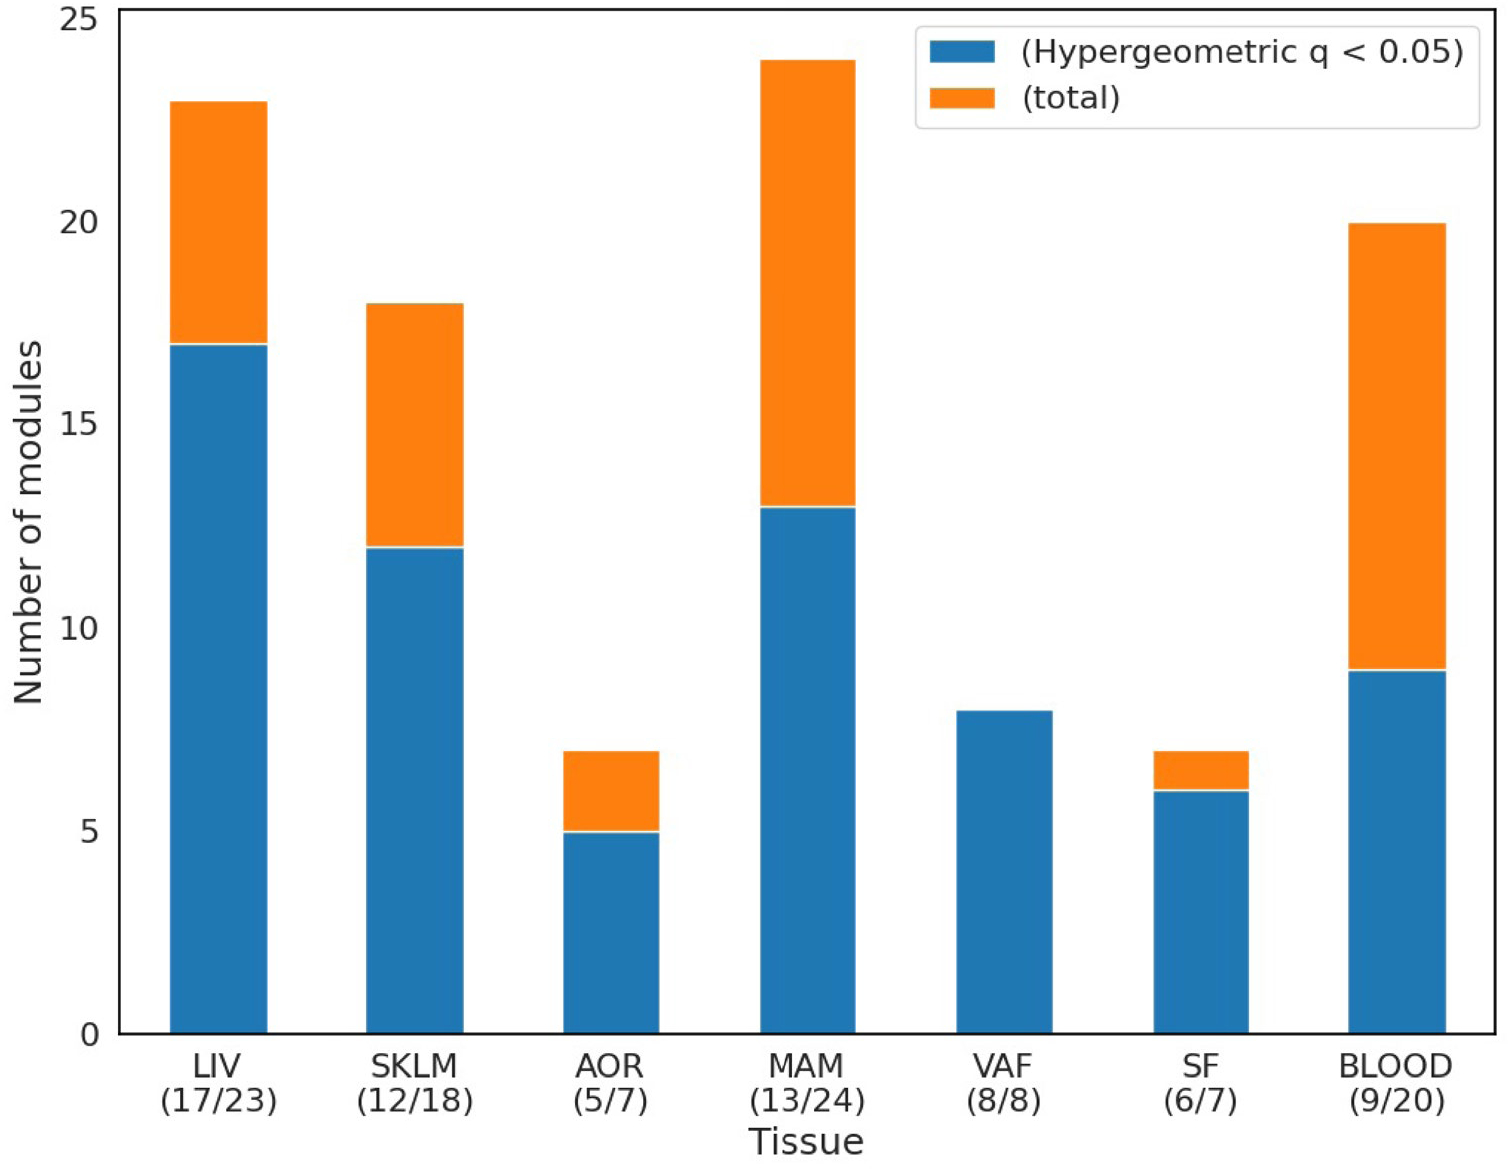
Stack plots showing fraction of tissue-specific GRNs considered causal in MR analysis (Methods). The hypergeom function from the SciPy stats package in Python62 was used to test overlaps with tissue-specific causal networks (blue, Extended Data Table 5) in relation to the total number of GRNs in each STARNET tissue (yellow, FDR < 5% according to Storey and Tibshirani63).