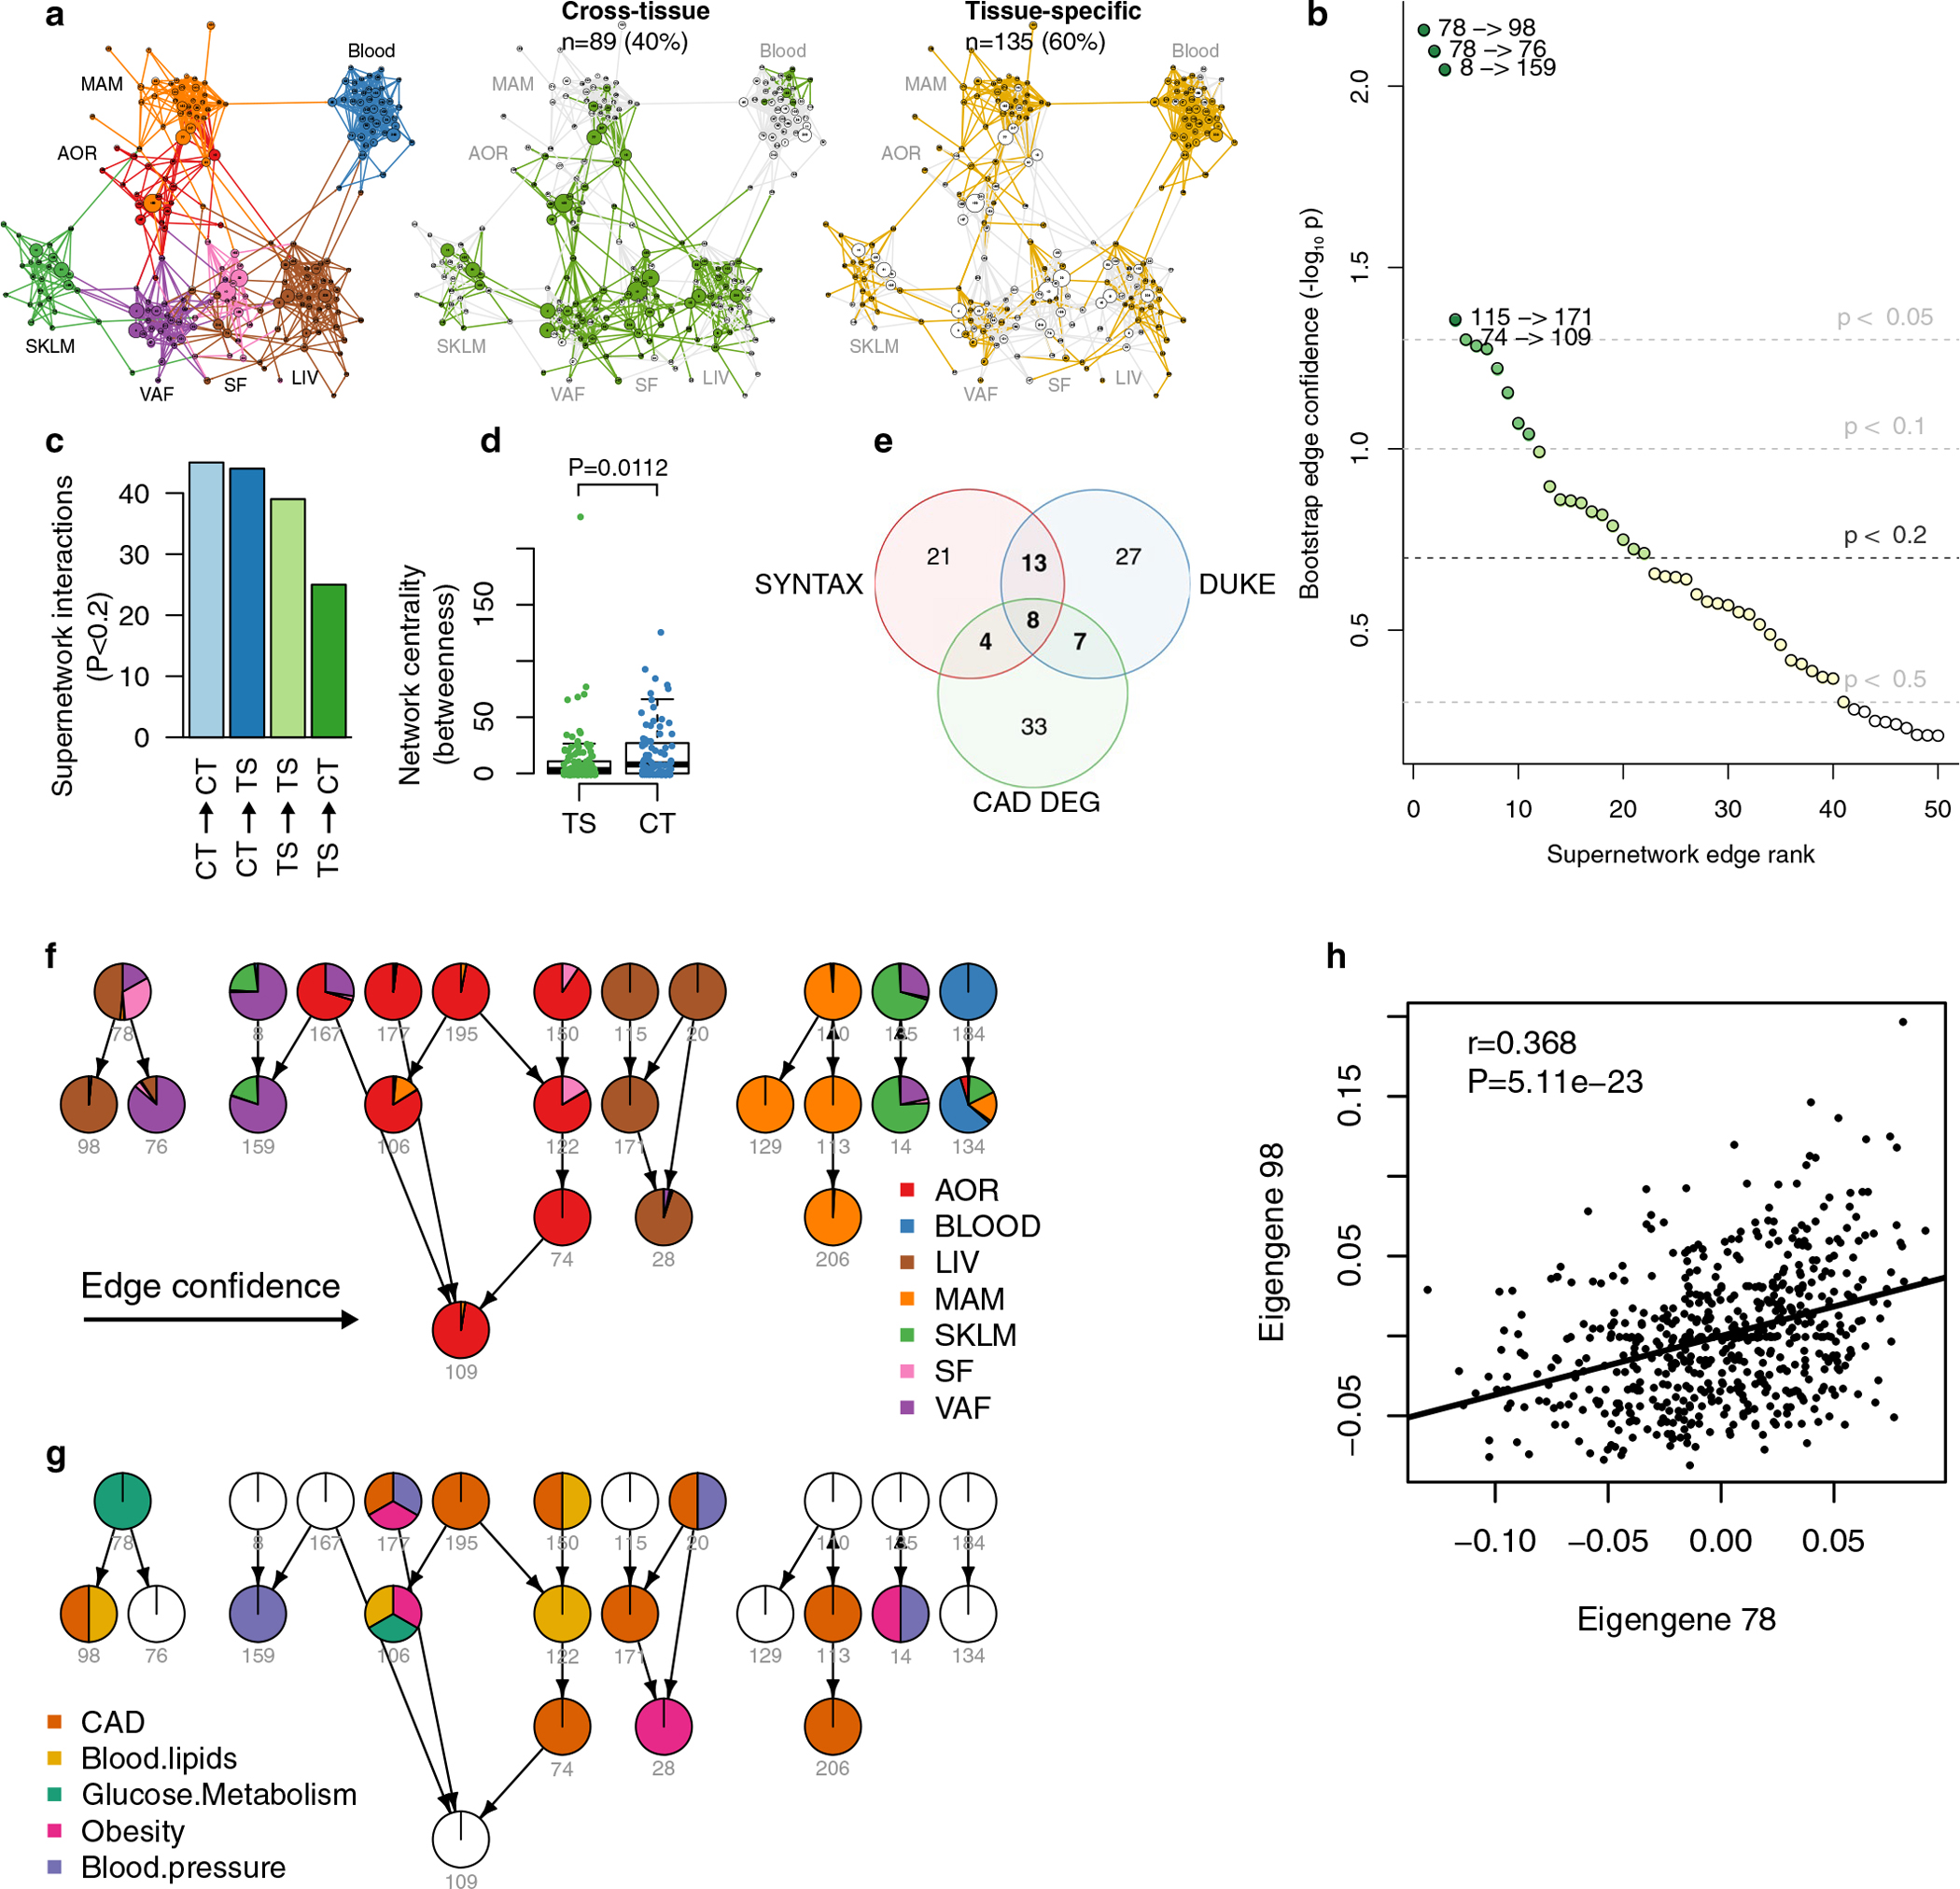
Extended Data Fig. 10 |. Modeling network module eigengene-eigengene interactions in a supernetwork to capture high-level tissue patterns of CAD disease progression.

a, Bayesian supernetwork inferred from eigengene values of the 224 STARNET co-expression modules. The likelihood of directed acyclic graphs was assessed using the Bayesian information criteria (BIC) and optimized using fast greedy equivalence search from Tetrad. Network layout was determined by the Fruchterman-Reingold algorithm. Left, colors indicate primary tissues, middle, green indicates cross-tissue network modules and right, yellow indicates tissue-specific network modules. b, Diagram showing bootstrap confidence estimates of supernetwork edges (Methods). Random sets of subjects were drawn and used to infer an ensemble of 1,000 Bayesian networks, from which supernetwork edges were ranked. Bootstrapped P values estimated by 1–frequency of edges in network ensemble. c, Bar plot showing the distribution of 153 statistically robust edges in the supernetwork among the four possible combinations of cross-tissue (CT) and tissue-specific (TS) module interactions. Edge robustness was assessed by bootstrap analysis (M = 10,000) of the full supernetwork of 224 module nodes and 49,952 possible edges (Methods). d, Box plots comparing centrality of cross-tissue modules (n = 89) compared to tissue-specific modules (n = 135). Median center, lower and upper quartile box, 1.5 interquartile range whiskers. The network centrality analysis was based on the betweenness measure, counting the number of shortest paths through each node, performed on a 224×224 matrix of supernetwork eigengene interaction P-values (bootstrap estimates). Comparison by two-sided t test. e, Venn diagram showing 113 GRNs significantly enriched in at least one of 3 CAD clinical measures; 32 GRNs with at least 2 CAD measures, and 8 GRNs with all 3 CAD measures. The CAD measures of the GRNs are enrichment with genes associated with SYNTAX (1) and/or Duke (2) scores (FDR < 0.01) and/or with DEGs in CAD cases versus controls (3). f,g, High-confidence directed edges in the supernetwork (see Methods) detected between 25 of the 32 CAD-associated GRNs with more than two CAD measures (a) colored according to module tissue distribution (f) and enrichment with candidate genes identified by GWAS (g and Fig. 3e). The layout was determined by the Sugiyama algorithm. Indicated below each supernetwork node is the GRN identification number. h, Scatter plot of Pearson correlations between the eigengene values of the most significant edge in the supernetwork between cross-tissue network module 78 and tissue-specific network module 98. P-values were calculated using a two-tailed t-test.
