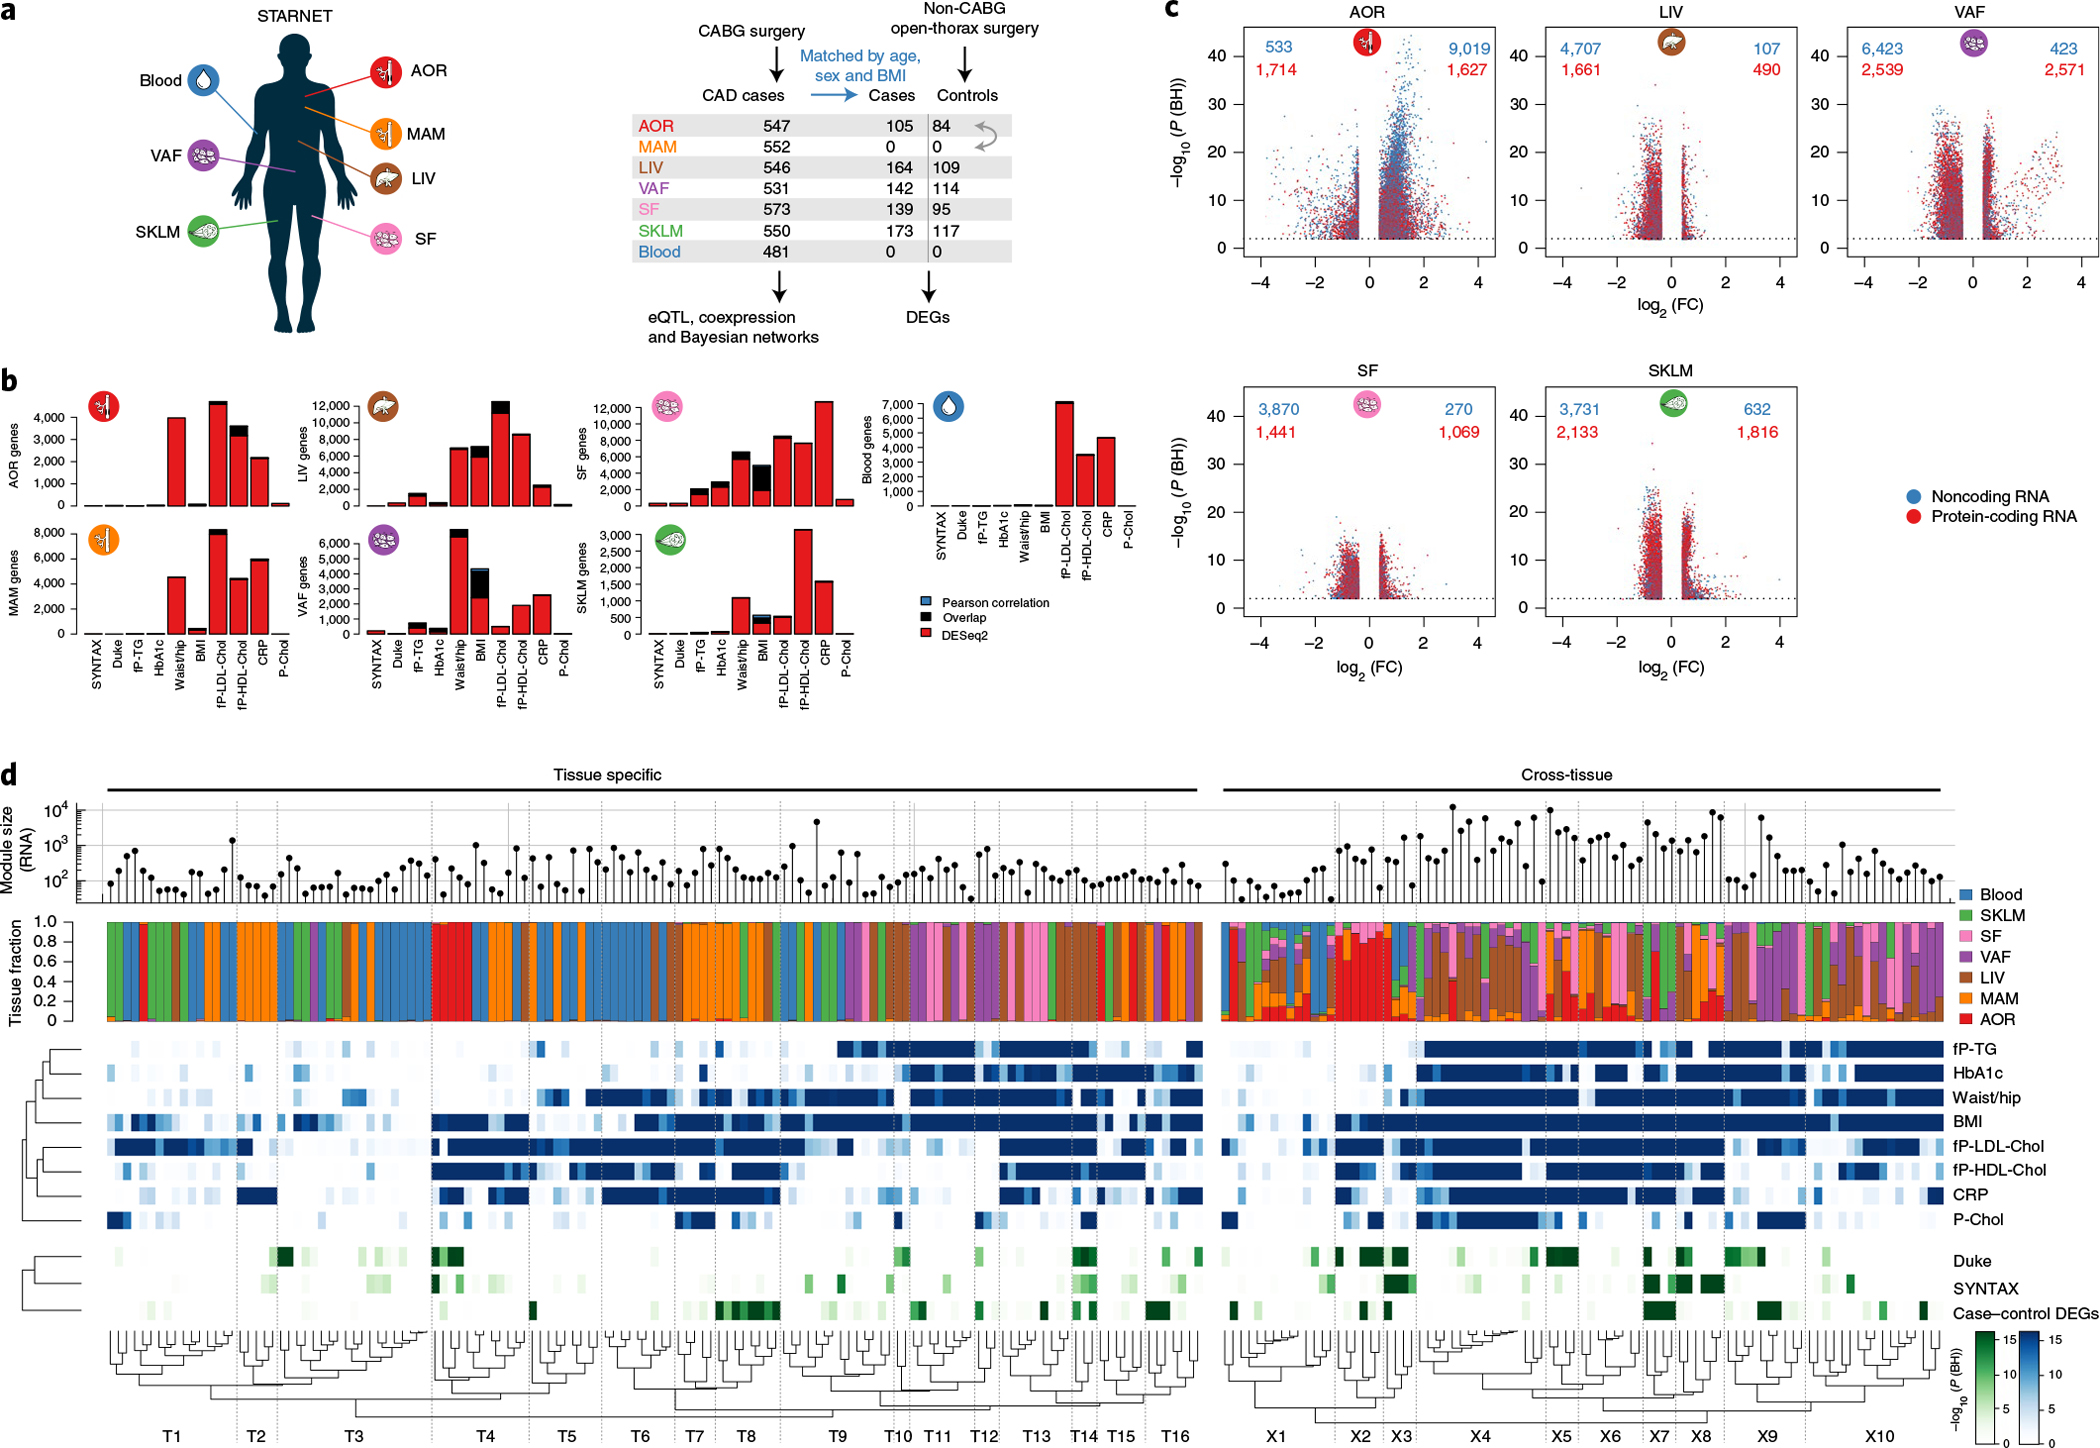
Fig. 2 |. Cross-tissue and tissue-specific coexpression network modules capture phenotypic variation associated with CMD and CAD traits.

a, Left, multi-tissue sampling in the STARNET study. Right, sample sizes and study design for generation and analysis of RNA-seq data from individuals with obstructive CAD and controls without obstructive CAD, verified by pre-operative coronary angiographs. Numbers of DEGs in each tissue were calculated from resequenced and randomized RNA samples isolated from individuals with CAD matched to controls by age, sex and BMI. The extent or absence of CAD was determined from pre-operative coronary angiograms and assessed by SYNTAX59 and Duke60 scores. b, Bar plots showing the number of genes associated with CMD and/or CAD traits either assessed with DESeq2, adjusting for age and sex (FDR < 0.01), or Pearson correlation with normalized gene expression (|r| > 0.2), which corresponds to Bonferroni correction at FDR < 0.14 (two-sample Student’s test, n = 500 patients and 21,500 genes). CRP, C-reactive protein; fP-Chol, fasting plasma total cholesterol levels; fP-LDL-Chol, fasting plasma LDL cholesterol levels; fP-HDL-Chol, fasting plasma high-density lipoprotein (HDL) cholesterol levels; fP-TG, fasting plasma triglyceride levels; P-Chol, plasma cholesterol levels. c, Volcano plots showing coding (red) and noncoding (blue) DEGs, comparing tissue samples from individuals with CAD and CAD-free controls (FDR < 0.01 and ±30% fold change). DESeq2 two-tailed statistics adjusted for multiple hypotheses with the Benjamini–Hochberg (BH) method. FC, fold change. d, Hierarchical clustering of 135 tissue-specific (left) and 89 cross-tissue (right) coexpression network modules. Modules were inferred from gene expression across all tissues in up to 572 individuals with CAD in the STARNET study followed by blockwise, weighted WGCNA with distinct β values for cross-tissue and tissue-specific correlations to achieve scale-free networks38. Modules containing >5% of transcripts from more than one tissue were defined as cross-tissue. Modules were annotated and clustered by tissue composition (multicolor), module enrichment in genes associated with metabolic phenotypes (blue) and with three CAD measures (green): module enrichments of DEGs from case–control tissues (hypergeometric test) and module meta-analysis of genes associated with SYNTAX and Duke scores. Enrichment for SYNTAX and Duke scores, along with metabolic phenotypes, were assessed by aggregate gene-level P values (Fisher’s method) based on Pearson correlation two-tailed t-tests. Multiple hypotheses for the 224 modules tested were adjusted separately for each association type using the Benjamini–Hochberg method.
