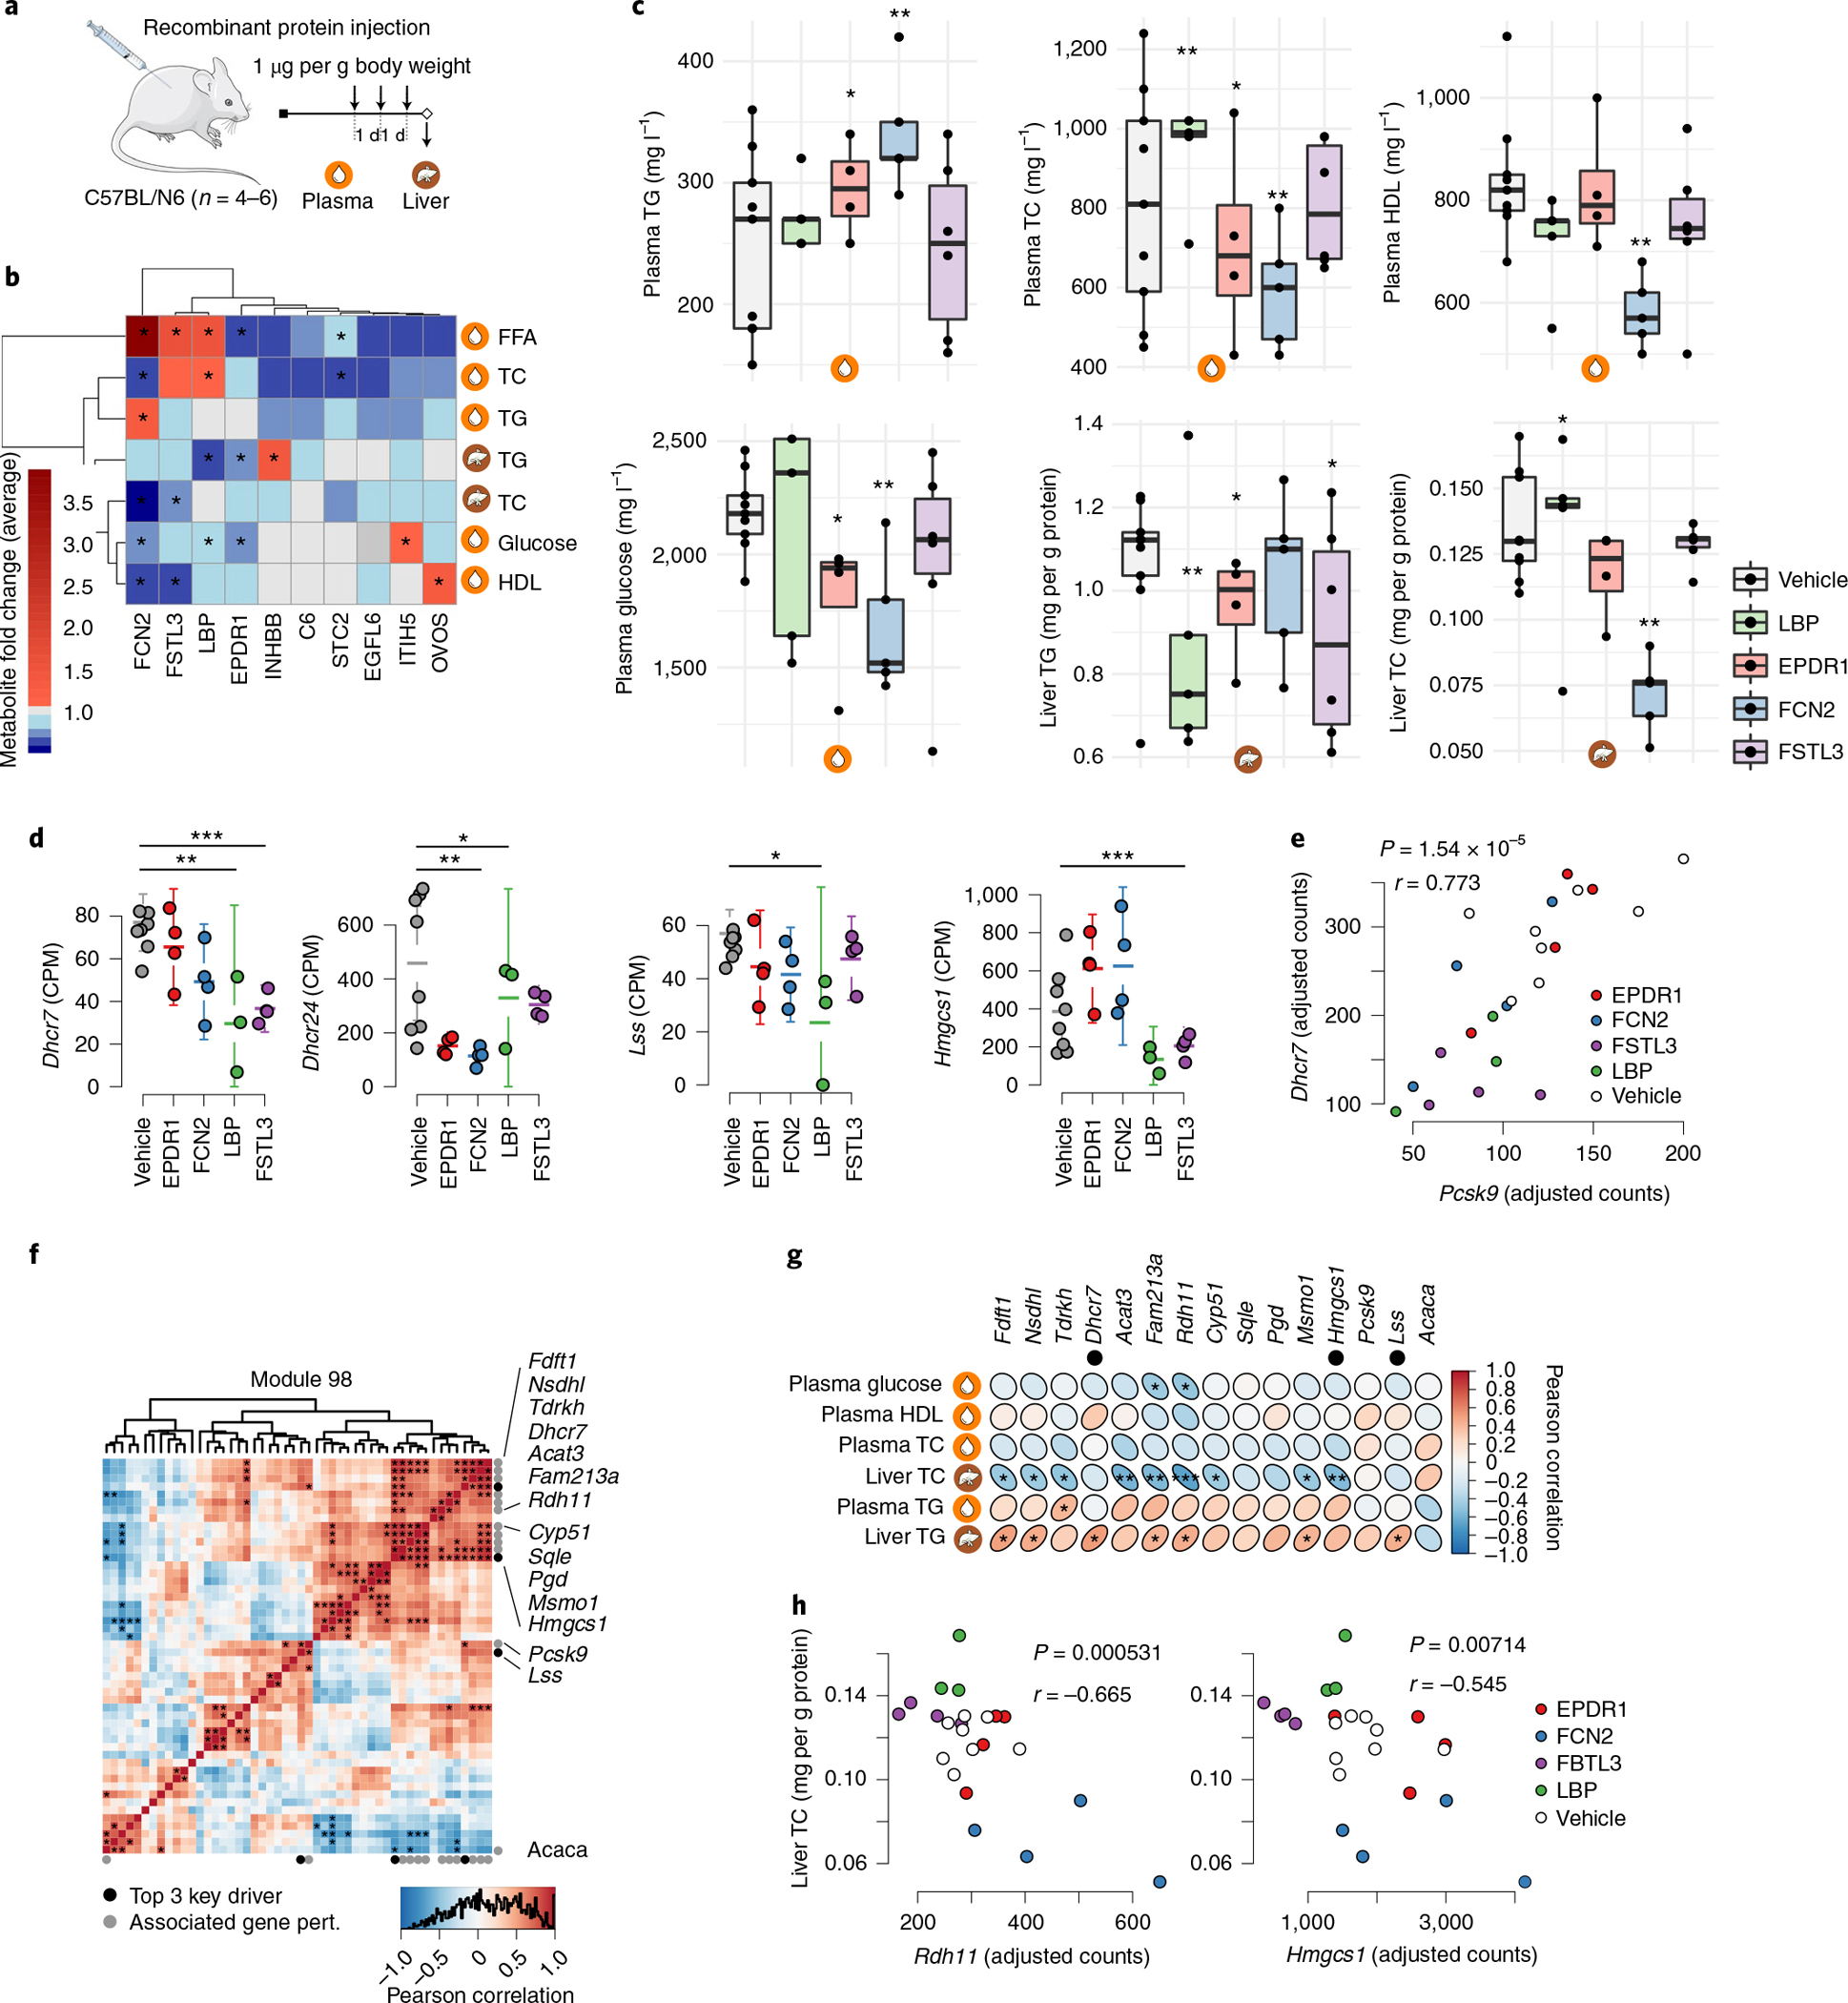
Fig. 7 |. Injection of mice with GRN78 endocrine factors affects GRN98 and levels of liver and plasma lipids and blood glucose.

a, Chow-fed C57BL6N mice were injected with purified recombinant proteins of the indicated endocrine factors or the vehicle control (secreted GFP) once daily for 3 d (1 μg per g body weight). Twenty-four hours after the final injection, mice were killed, and the liver and plasma were collected for RNA isolation and metabolite screening. b, Heatmap showing changes in liver and plasma lipid and glucose levels in response to injection of recombinant forms of ten adipose endocrine candidates in GRN78 compared to those of control mice injected with GFP. *P < 0.01 by two-tailed t-test. c, Box plots comparing concentrations of plasma and liver lipid and blood glucose levels (y axis) after injecting recombinant endocrine factors (x axis). n = 3–8 independent animals per treatment group. Median, center; lower and upper quartiles, box; 1.5 × interquartile range, whiskers. Two-tailed t-tests. *P < 0.05, **P < 0.005, ***P < 0.001 versus vehicle (GFP). d, Mean plots showing mRNA expression of top key drivers in GRN98 (Dhcr7, Dhcr24, Lss and Hmgsc1) after injection of recombinant endocrine factors. Batch-adjusted DESeq2 negative binomial two-tailed tests, corrected for multiple hypotheses genome-wide with the Benjamini–Hochberg method. For visualization, expression values were normalized by counts per million (CPM). n = 4–6 independent animals per treatment group. Error bars are s.e.m. *FDR < 0.05, **FDR < 0.01, ***FDR < 0.001 versus vehicle. Tests are batch-adjusted DESeq2, corrected for multiple hypotheses genome-wide. e, Scatterplot showing correlation of Dhcr7 and Pcsk9 expression levels after injections (Pearson correlation, two-tailed t-test). f, Heatmap showing GRN98 gene correlations in liver RNA-seq data after injecting recombinant endocrine factors. Black dots indicate the top three key drivers previously identified10, and gray dots indicate significantly associated genes. *FDR < 0.05, adjusted by the Benjamini–Hochberg method. Pert., perturbation. The official NCBI Gene symbol for Fam213a is PRXL2A. g, Heatmap showing Pearson correlations between GRN98-associated genes (d) and hepatic and plasma lipid and blood glucose levels after injecting recombinant endocrine factors. Two-tailed correlation t-tests. *P < 0.05, **P < 0.01, ***P < 0.001. The top three key drivers are indicated by black dots. h, Scatterplot showing liver cholesterol levels (y axis) and expression levels of Rdh11 and Hmgsc1 (x axis) after injecting recombinant endocrine factors. Pearson correlation, two-tailed t-tests.
