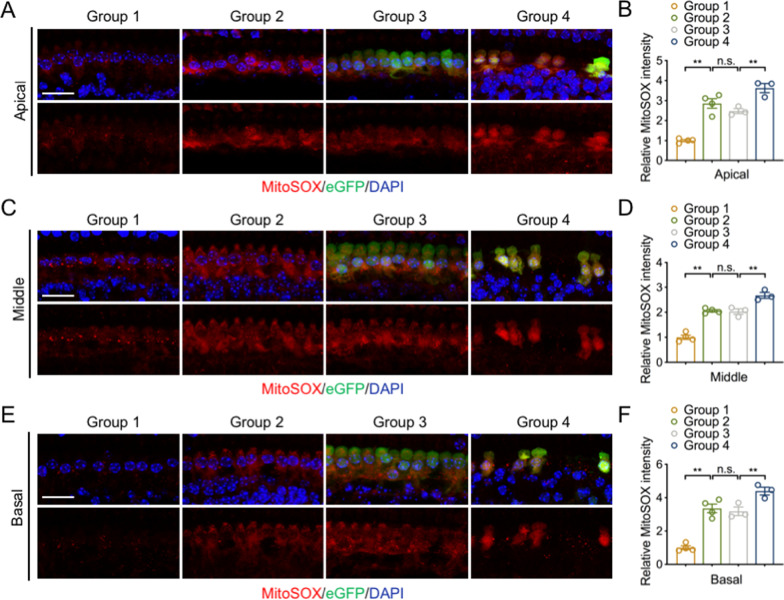
Fig. 4.
UCP2 overexpression increases mitochondrial oxidative stress. A, C and E Representative IF images of mitoSOX (red) in the apical, middle and basal turns in the different groups. Nuclei were labeled with DAPI (blue). Scale bar, 20 μm. B, D and F The relative fluorescence intensity of mitoSOX in the apical, middle and basal turns in the different groups (n = 3–4 ears/group). UCP2 uncoupling protein 2, n.s. no significance, **p < 0.01

