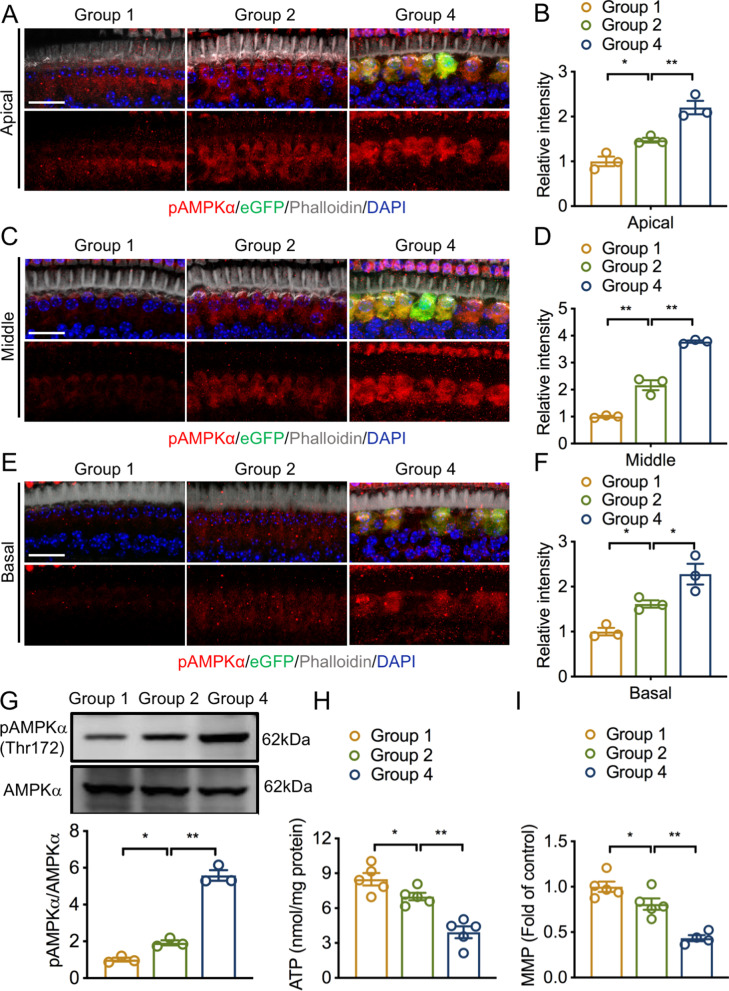
Fig. 5.
UCP2 overexpression reduces ATP and MMP levels and promotes AMPK activation. A, C and E Representative IF images of AMPKα (red) in the apical, middle and basal turns. AAV-ie vector and nuclei were labeled with anti-GFP (green) and DAPI (blue), respectively. Scale bar, 20 μm. B, D and F The relative fluorescence intensity of pAMPKα in the apical, middle and basal turns (n = 3 ears/group). G Western blots and analysis for pAMPKα and AMPKα in the different groups (n = 3 independent experiments). H The ATP levels measured by a commercial ATP assay kit (n = 5 independent experiments). I The MMP levels measured by a JC-1 assay kit (n = 4–5 independent experiments). UCP2 uncoupling protein 2, ATP adenosine triphosphate, AMPK AMP-activated protein kinase α, pAMPK phosphorylated AMPK, MMP mitochondrial membrane potential, n.s. no significance, *p < 0.05, **p < 0.01

