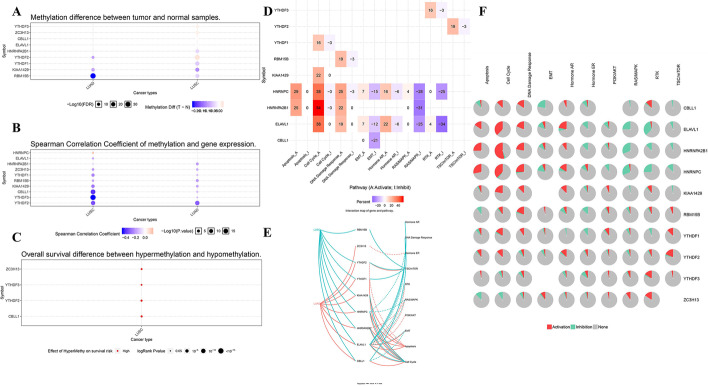
Fig. 5.
The association between m6A-related genes and methylation and the role of m6A-related genes in cancer-related pathways. A Methylation difference between tumor and normal samples in LUAD and LUSC. B Spearman Correlation Coefficient of methylation and gene expression in LUAD and LUSC. C Overall survival difference between hypermethylation and hypomethylation in LUSC. D Global percentage of activity of m6A-related gene pathway in LUAD and LUSC. A represents Activate, while I represents Inhibit. E Interaction map of m6A-related genes and pathway in LUAD and LUSC. Solid line represents activation, while dotted line means inhibition. F Pie percentage of activity of m6A-related gene pathway in LUAD and LUSC. Red part means activation, while green part represents inhibition

