Fig. 7.
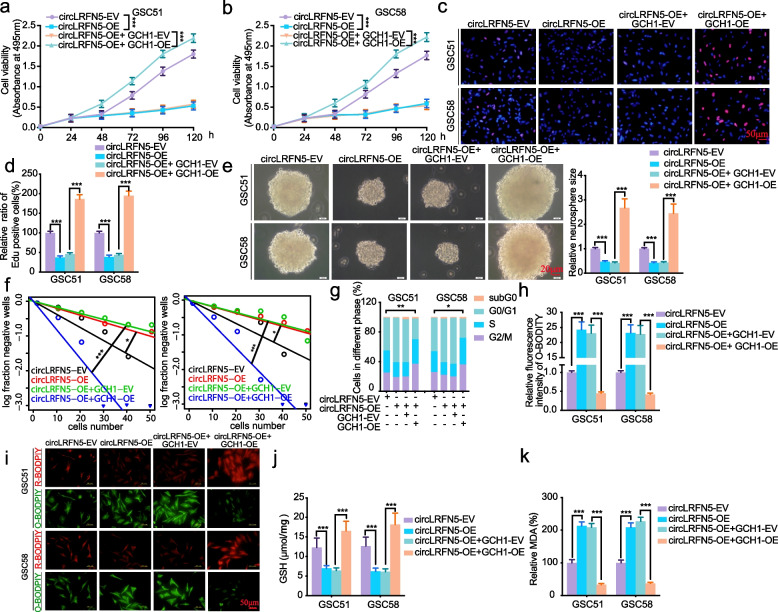
CircLRFN5 promotes ferroptosis via down-regulating GCH1 in GSCs. a, b MTS assays showed the cell viabilities of circLRFN5 overexpressed GSC51 (a) and GSC58 (b) after GCH1 overexpression. c, d Representative images of EdU assays showed the proliferation of circLRFN5 overexpressed GSC51 and GSC58, followed by GCH1 overexpression. Scale bar = 50 μm. e Representative images of neurospheres formation assays showed the relative sizes of neurospheres of circLRFN5 overexpressed GSC51 and GSC58, followed by GCH1 overexpression. Scale bar = 20 μm. f ELDA assays showed the neurospheres formation abilities of circLRFN5 overexpressed GSC51 (left) and GSC58 (right), followed by GCH1 overexpression. g Cell cycle assays showed the cell cycle distributions of circLRFN5 overexpressed GSC51 and GSC58, followed by GCH1 overexpression. h, i Representative images of BODIPY (581/591) C11 staining in circLRFN5 overexpressed GSC51 and GSC58, followed by GCH1 overexpression. The relative fluorescence intensity of O-BODIPY was quantified by image J. Scale bar = 50 μm. j, k GSH (j) and MDA (k) levels were detected in circLRFN5 overexpressed GSC51 and GSC58, followed by GCH1 overexpression. All data are expressed as the mean ± SD (three independent experiments). *p < 0.05; **p < 0.01; ***p < 0.001

