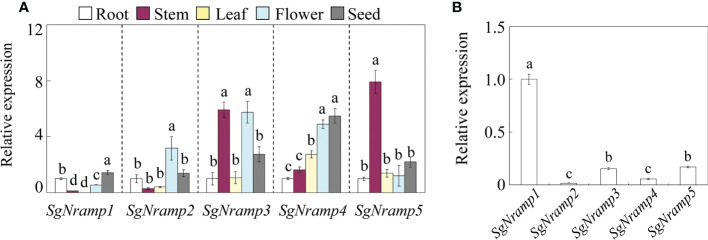
Figure 3.
Expression analysis of SgNramps in various tissues. (A) Expressions of SgNramps in root, stem, leaf, flower, and seed. The expression of each gene in the roots was set to one, and then the expression level of each gene in other tissues was normalized to its expression in the roots. (B) Expressions of SgNramps in stylo root. The expression of SgNramp1 was set to one, and then the expression level of the other SgNramps was normalized to SgNramp1. Data are means of three biological replicates with standard error (SE). Different letters represent significant differences among various tissue (A) or SgNramp genes (B) at P < 0.05.

