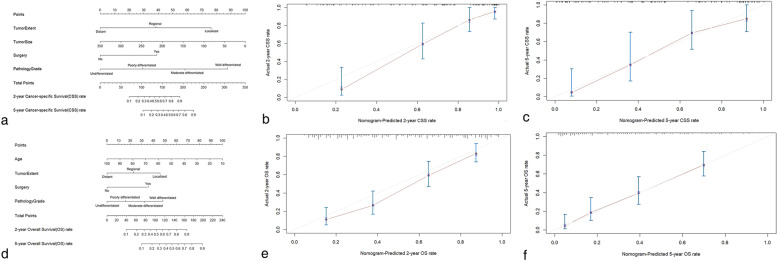
Fig. 4.
The graphs showed nomograms and related calibration curves for 2, 5-year (A-C) cancer-specific survival; D-F overall survival, respectively. For example, when a 60-year-old patient (CSS points = N/A, OS points = 45) with regional (CSS points = 38, OS points = 23), poorly differentiated (CSS points = 30, OS points = 18) UMBT (tumor size = 100 mm [CSS points = 72, OS points = N/A], no previous primary tumor surgery [CSS points = 0, OS points = 0]) were presented to the institution, total points of 140 and 86 were assessed on this patient for CSS and OS estimation, respectively. The estimated 2, 5-year CSS and OS rates were 58, 32 and 35%, 16%, respectively

