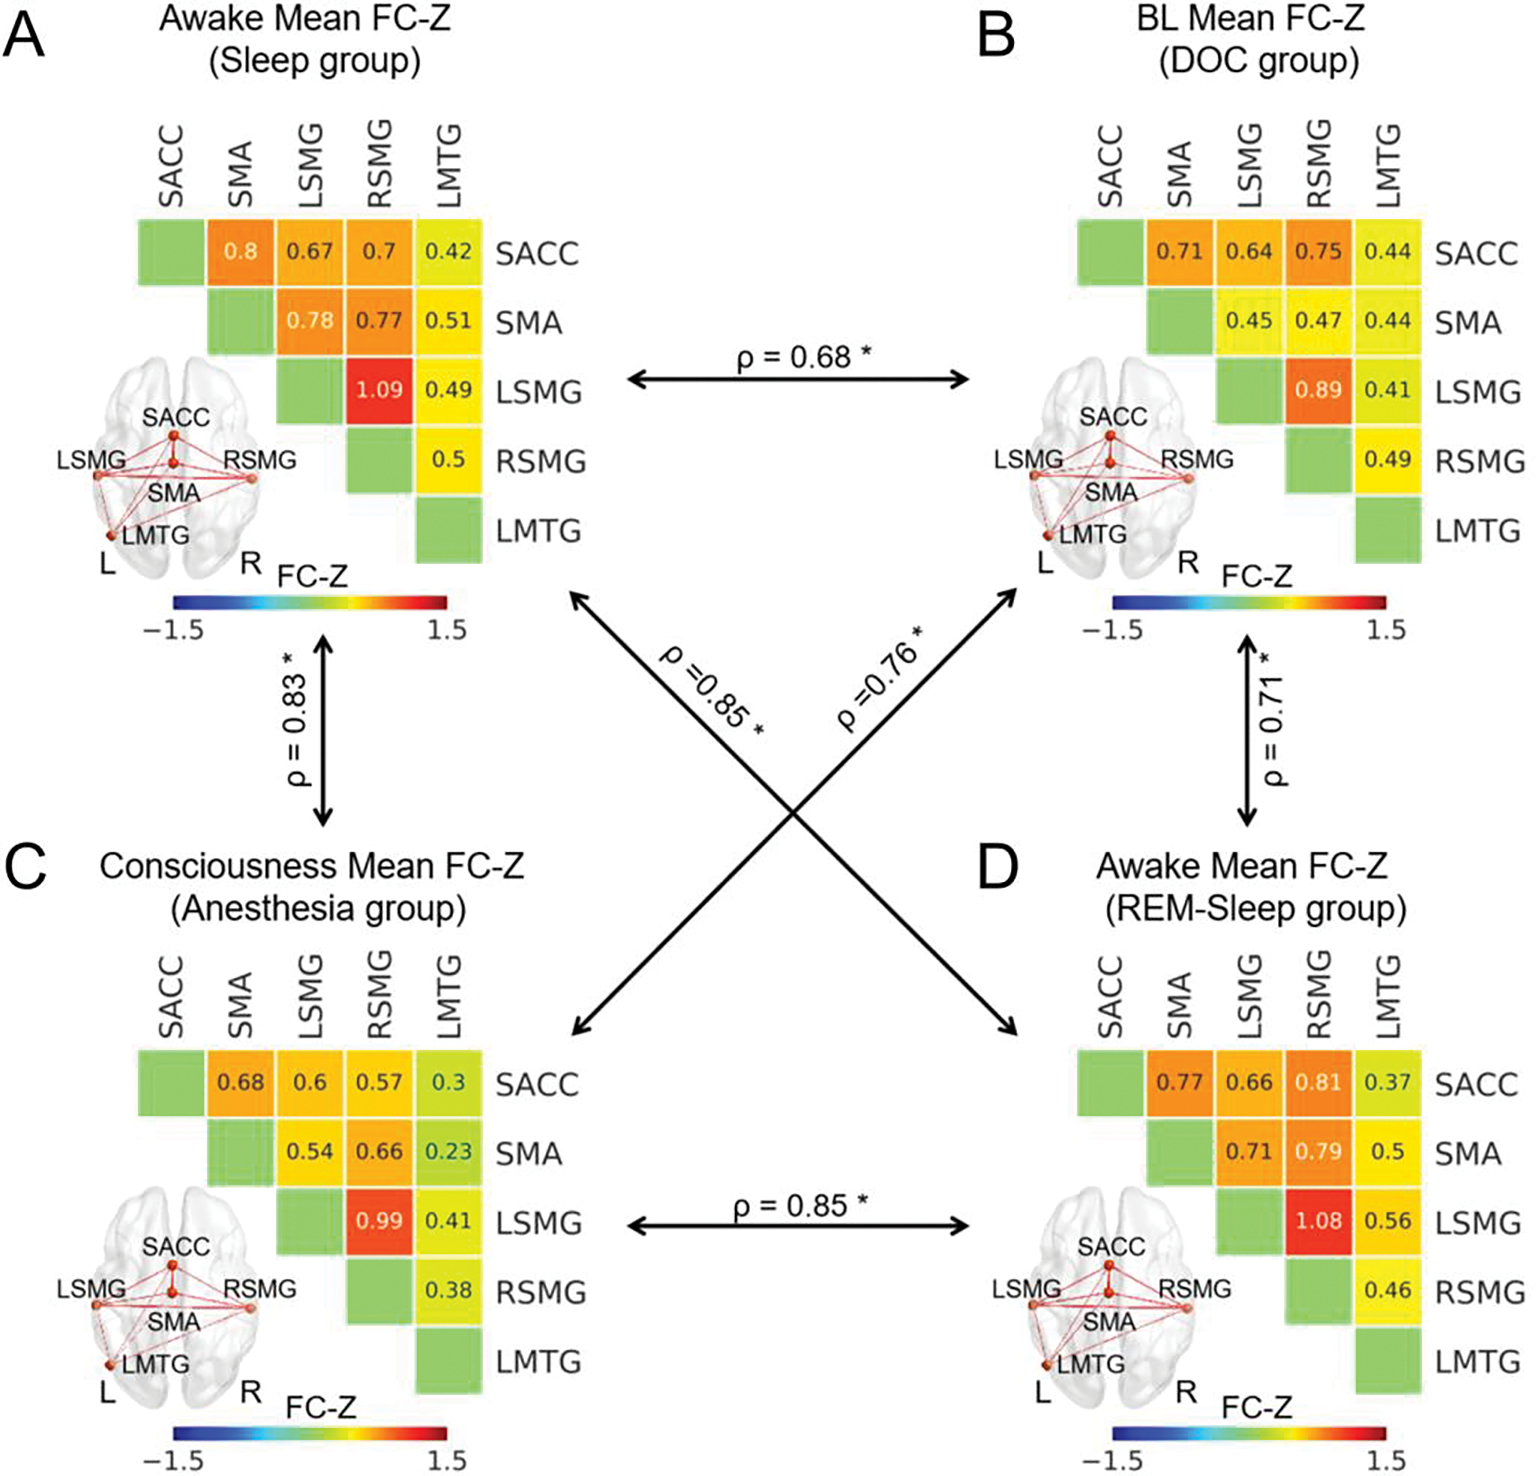
Fig. 4.

ROI-wise functional connectivity during consciousness in all four groups. The ROI-wise functional connectivity z-values for the awake-state in the sleep group (A), for BL patients in the DOC group (B), for the conscious state in the anesthesia group (C), and for the awake-states in the REM-sleep group (D). The black arrow represented the correlation of these functional connectivity between each pair of groups which was calculated through the Spearman’s correlation. * means p < 0.05 FDR corrected. The thickness of lines in brain image represented the functional connectivity z-values between two states.
