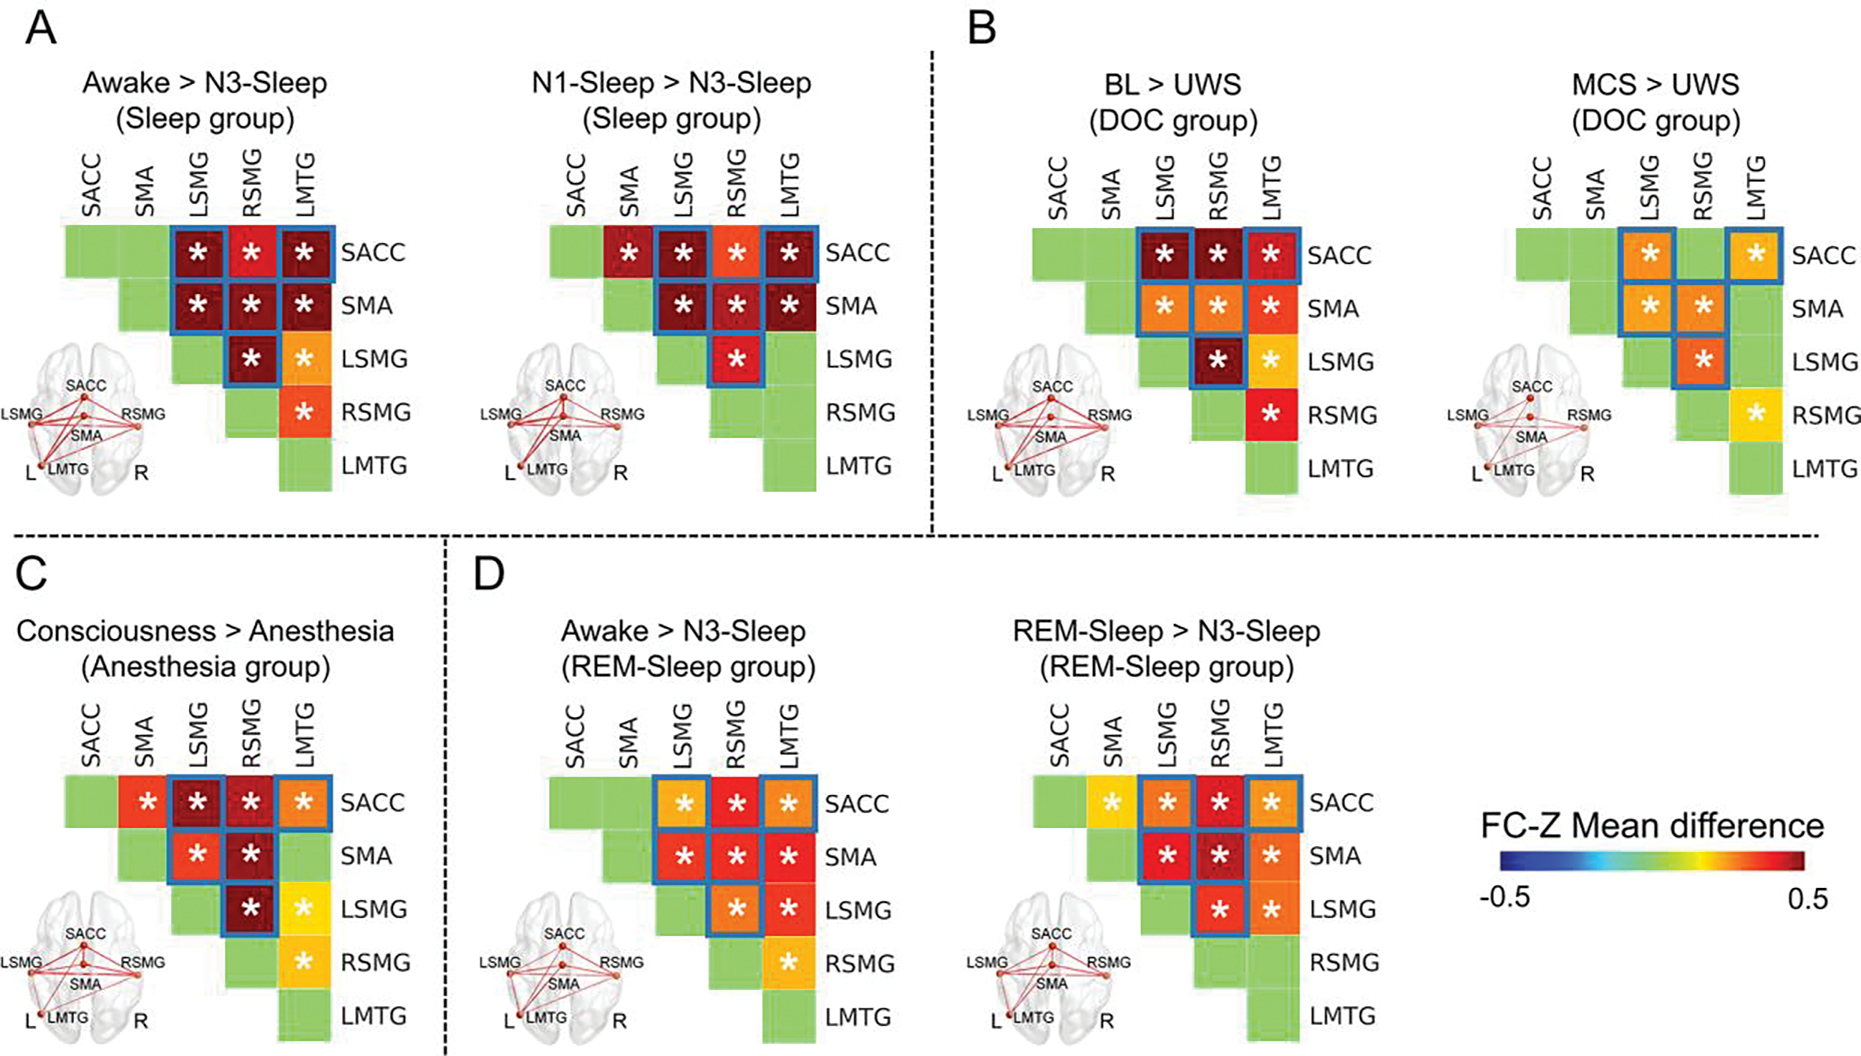
Fig. 6.

Reduced functional connectivity during unconsciousness. (A) Functional connectivity (FC) with significant reduction in the N3-sleep compared with awake and N1-sleep in the sleep group. (B) FC with a significant reduction in UWS compared with BL and MCS in the DOC group. (C) FC with a significant reduction in anesthesia compared with consciousness in the anesthesia group. (D) FC with significant reduction in N3-sleep compared with awake and REM-sleep in the REM-sleep group. * means p < 0.05, corrected. The functional connectivity marked with blue squares showed consistent reduction during unconsciousness in all four groups. The thickness of lines in brain image represented the difference of functional connectivity between two states.
