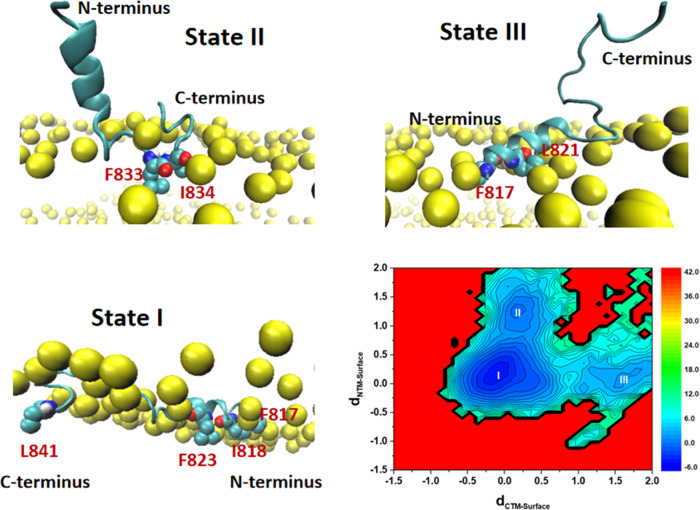
Figure 11.
Two-dimensional (2D) free-energy landscape for the interaction between the FP-S and the POPC bilayer (30% cholesterol), and the free energy unit is kJ/mol. dCTM-Surface represents the z distance from the FP C-terminus to the POPC bilayer surface, while dNTM-Surface corresponds to the z distance from the FP N-terminus to the POPC bilayer surface. We labeled the most stable state with I and two metastable states with II and III. Some hydrophobic residues of the FP-S are represented by color spheres and the phosphate groups by yellow spheres.

