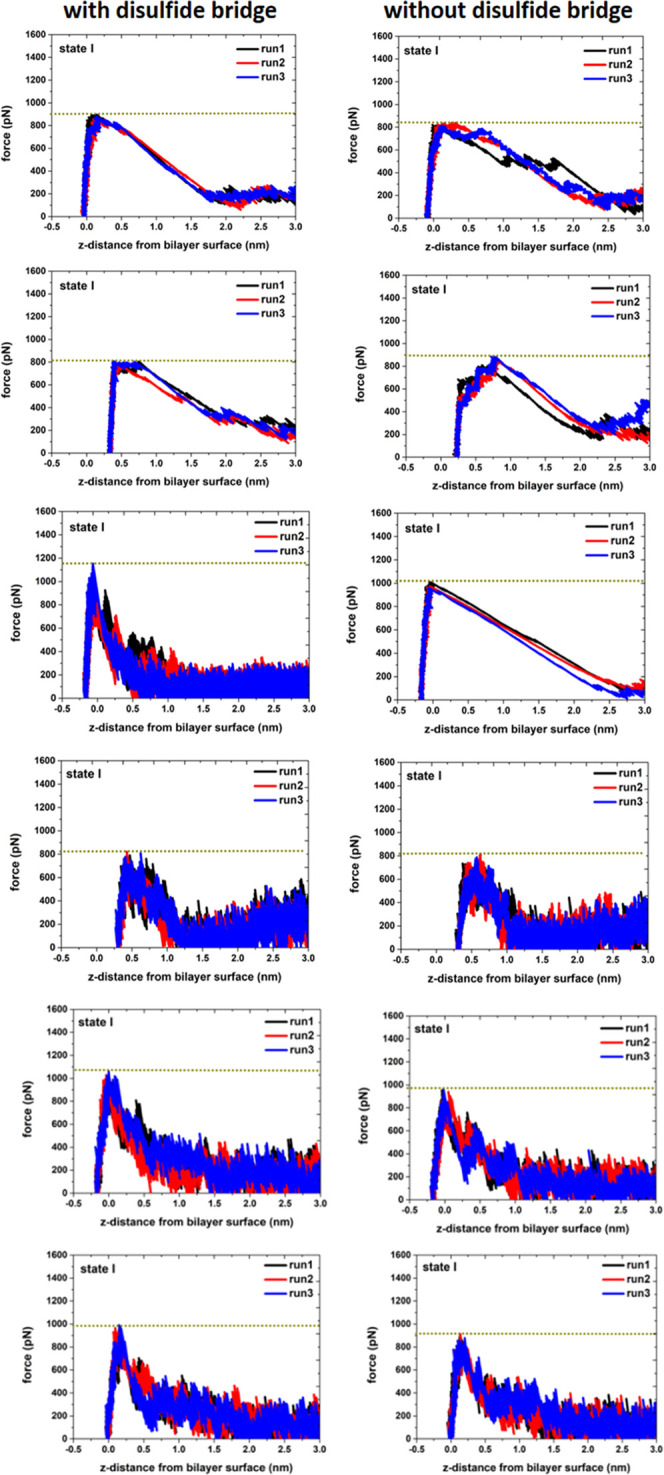
Figure 16.

Comparison between the force-extension curves for pulling the FP-L-SS (left pannel) and the FP-L-noSS (right panel) away from the POPC/cholesterol bilayer surface.

Comparison between the force-extension curves for pulling the FP-L-SS (left pannel) and the FP-L-noSS (right panel) away from the POPC/cholesterol bilayer surface.