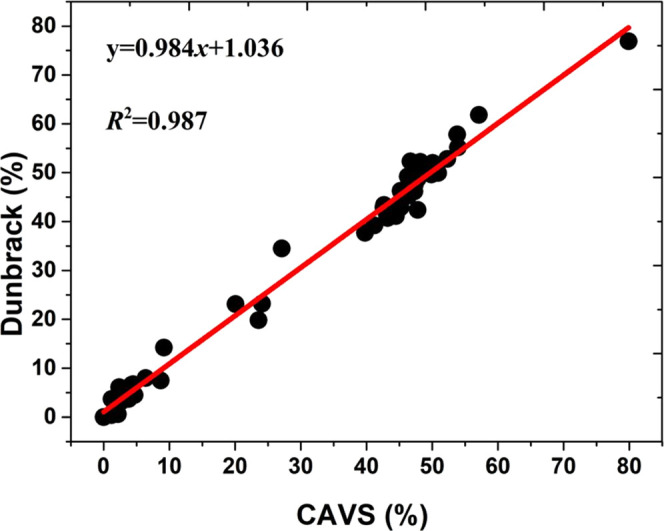
Figure 8.

Correlation between the CAVS CG and the Dunbrack library results for the relative population of the three dominant regions (αL, αR, and PPII + β,) based on the backbone distributions (ϕ/ψ) of 20 amino acid dipeptides.

Correlation between the CAVS CG and the Dunbrack library results for the relative population of the three dominant regions (αL, αR, and PPII + β,) based on the backbone distributions (ϕ/ψ) of 20 amino acid dipeptides.