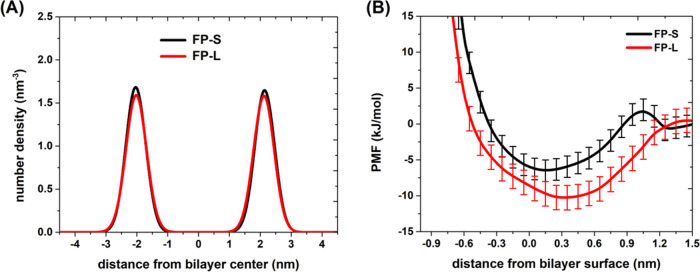
Figure 9.
(A) Number density distribution of the phosphate (P) groups of POPC, constructed based on the CAVS CG simulations of POPC/cholesterol bilayer bound with the FP-S (black) and FP-L (red). (B) PMF curves for binding the FP-S (black) and FP-L (red) to the bilayer membrane. The error for the PMF curves was estimated using the bootstrapping method.

