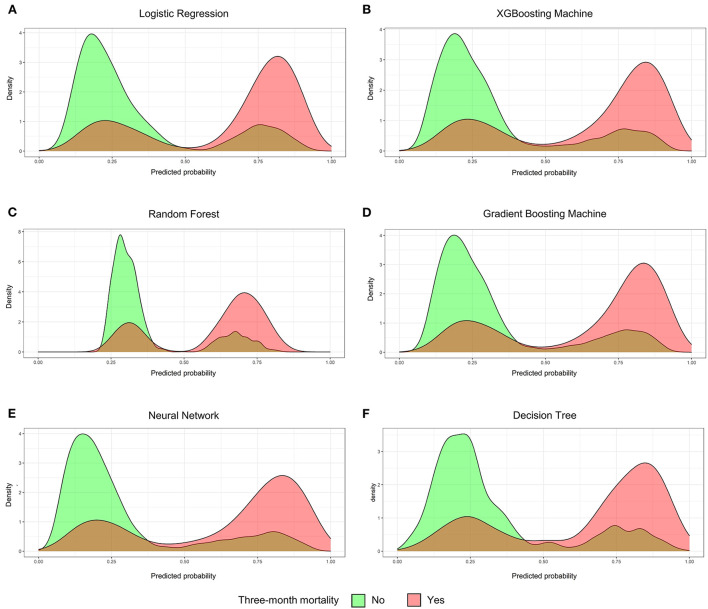
Figure 3.
The probability curves. (A) Logistic Regression; (B) XGBooting Machine; (C) Random Forest; (D) Gradient Boosting Machine; (E) Neural Network; (F) Decision Tree. The green group indicates patients were alive for above 3 months and the red group indicates patients were died at or within 3 months.

