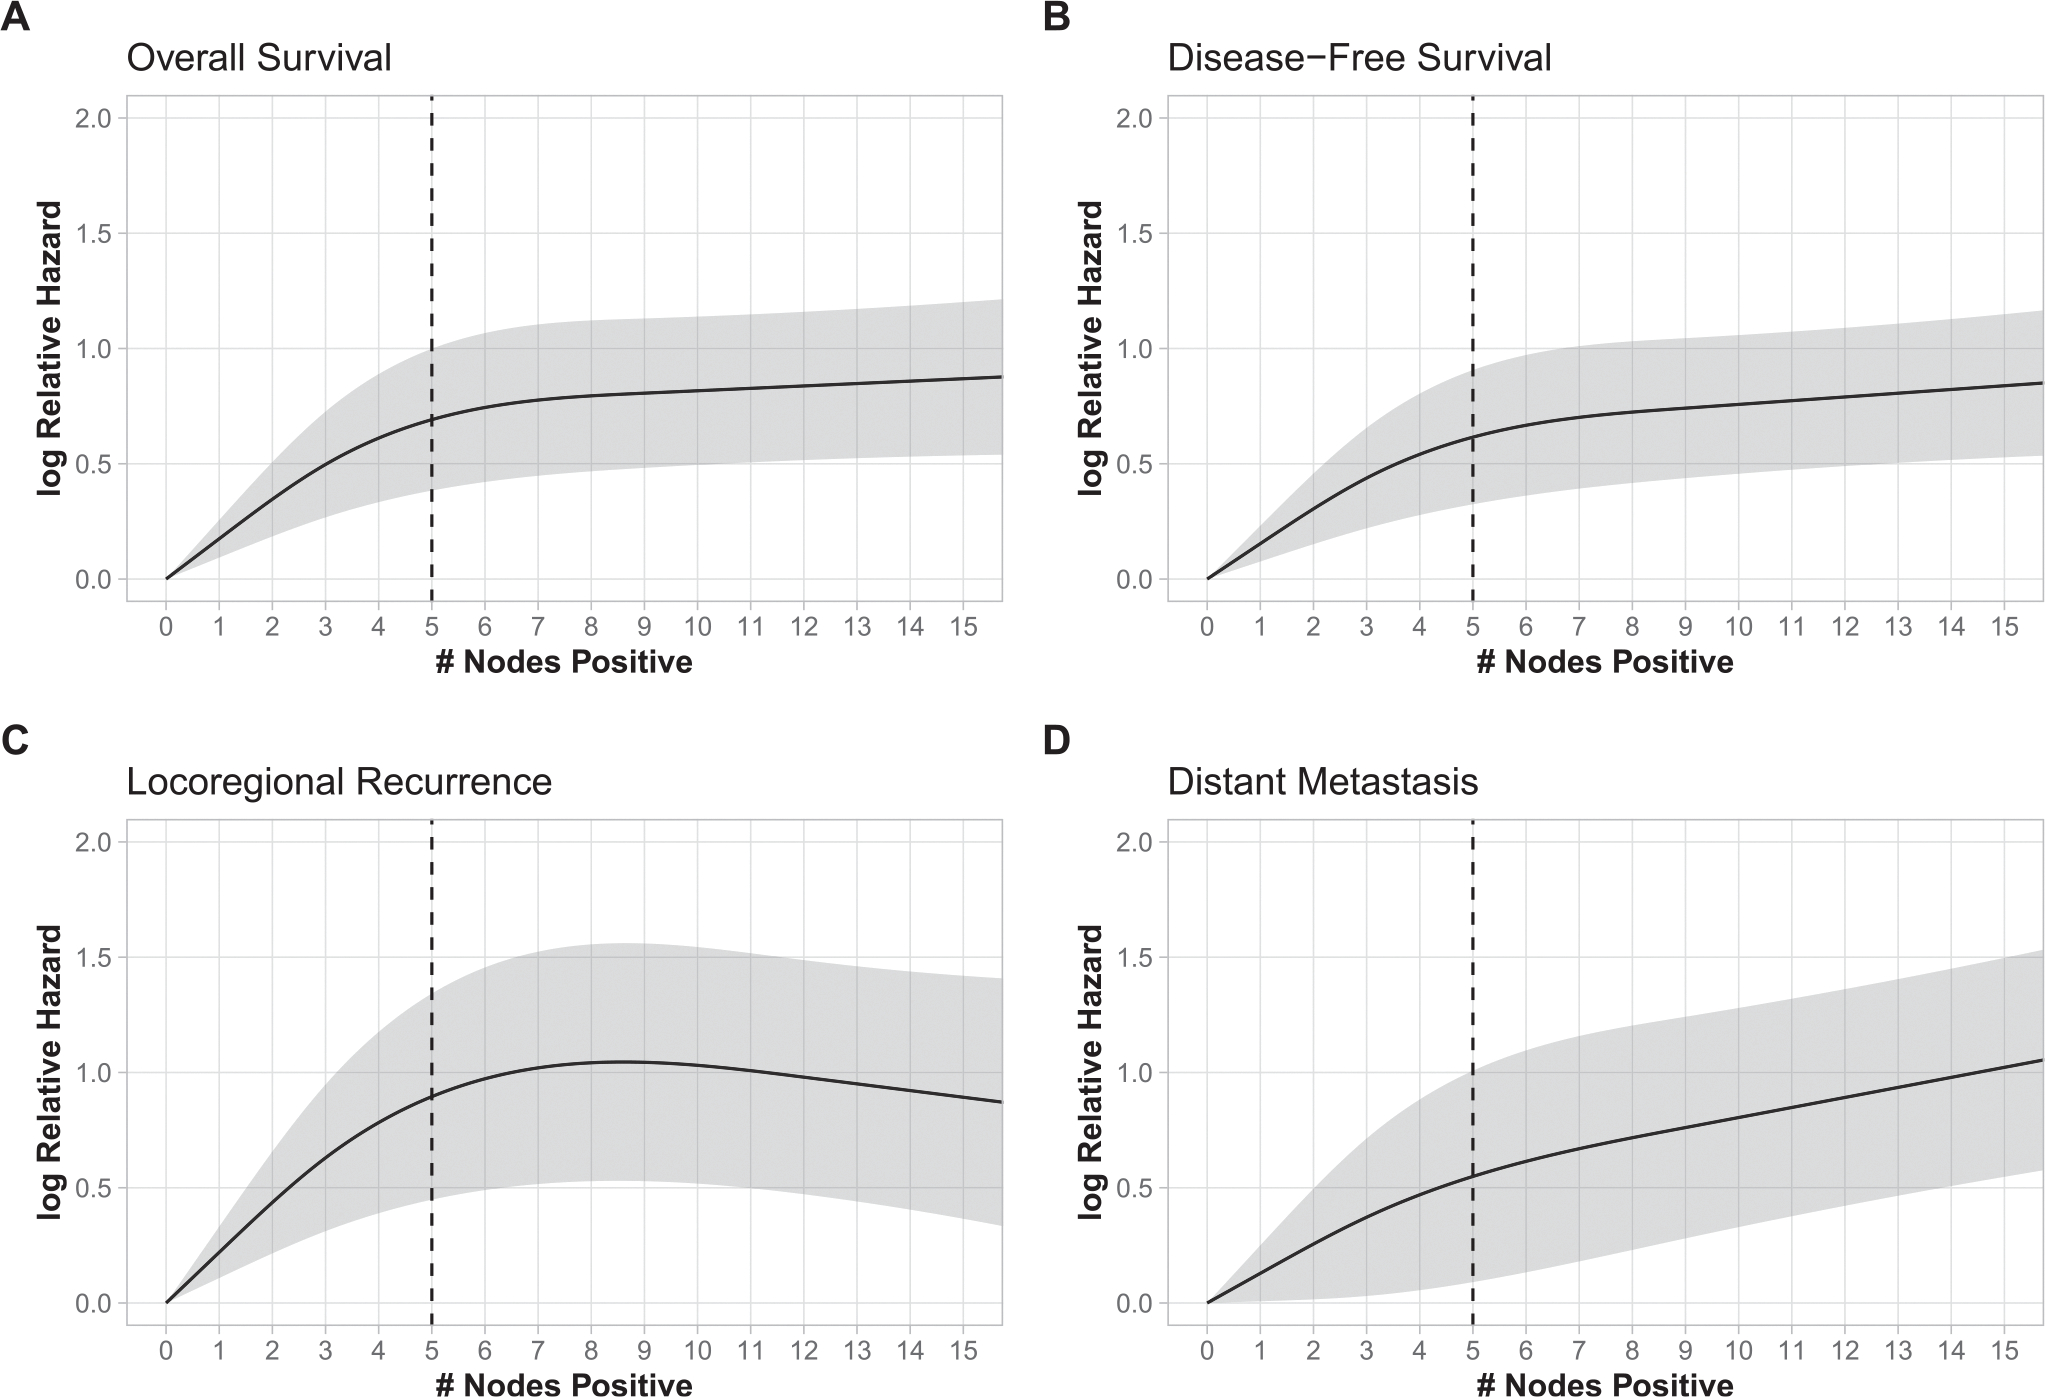
Fig. 1.

The natural logarithm of the adjusted hazard ratio of risk/event as a nonlinear function of the number of positive lymph nodes, with 0 positive lymph nodes as a reference for (A) overall survival, (B) disease-free survival, (C) locoregional recurrence, and (D) distant metastasis. The gray area represents the 95% pointwise confidence interval of the natural logarithm of the predicted hazard ratios. The black curve represents the smoothed restricted cubic spline plot of the natural logarithm of the predicted adjusted hazard ratio versus the number of positive lymph nodes. The black vertical dotted line represents the calculated change point.
