Figure 1.
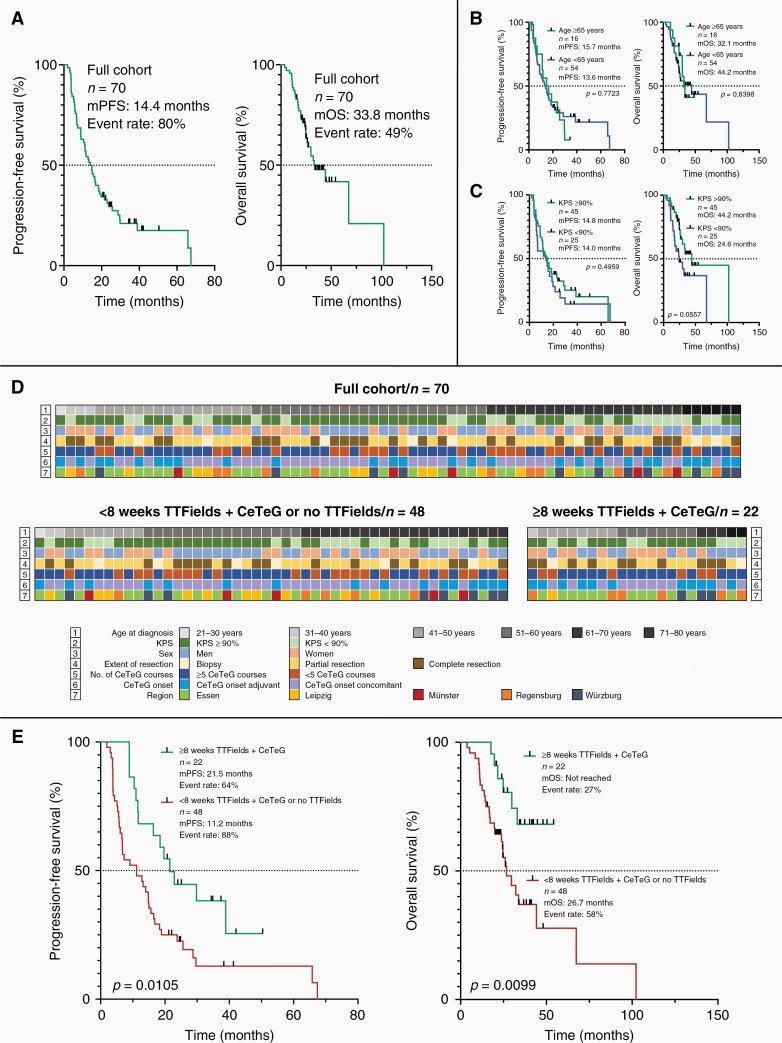
Kaplan–Meier curves and individual patient information. For the full multicentric cohort mPFS was 14.4 months at an event rate of 80% and mOS was 33.8 months at an event rate of 49% (a). The subgroup of patients ≥ 65 years of age did not perform significantly worse in respect to OS and PFS than the patients < 65 years of age (b). For KPS, overall survival appeared slightly longer in patients with a KPS ≥ 90% compared to those with a KPS < 70% (c). In (d) individual patient’s characteristics for all patients as well as comparatively for the subgroup of patients with < 8 weeks TTFields + CeTeG or no TTFields treatment and for the subgroup of patients with ≥ 8 weeks TTFields + CeTeG treatment are illustrated. Treatment in the latter subgroup resulted in a longer median progression-free and overall survival than in the subgroup of patients with < 8 weeks TTFields + CeTeG or no TTFields treatment (e). KPS, Karnofsky performance score; mOS, median overall survival; mPFS, median progression-free survival; No., number; OS, overall survival; PFS, progression-free survival; TTFields, tumor treating fields.

