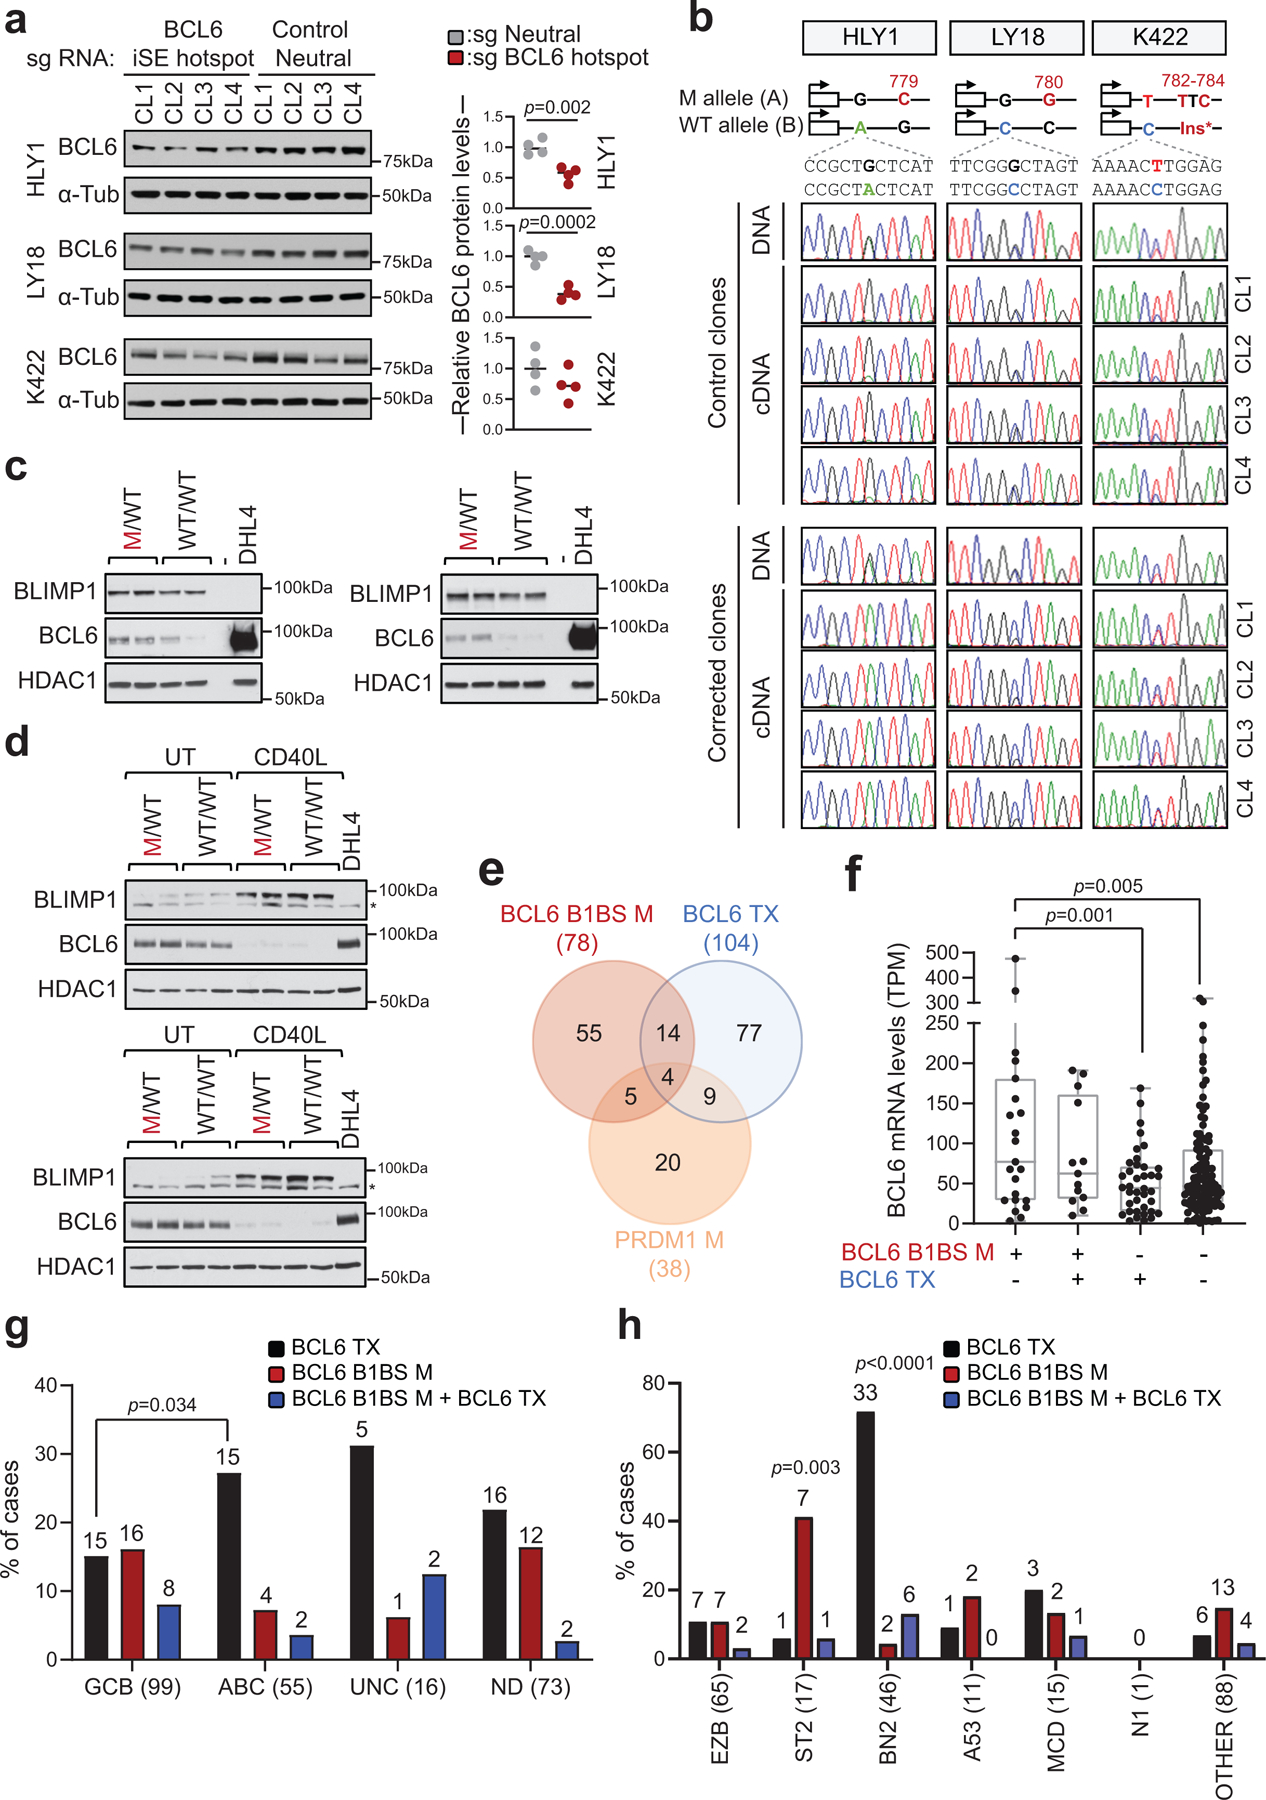
Extended Data Figure 11: Mutations in the BCL6-B1BS are enriched in GCB- and ST2-DLBCL.

a. Immunoblot analysis of BCL6 protein expression in isogenic clones obtained from HLY1, LY18 and Karpas-422 after CRISPR-Cas9-mediated correction of specific mutations in the BCL6-iSE hotspot or after introduction of mutations in the control neutral region (n=4 clones/sgRNA; related to Fig. 3c,d). α-Tubulin, loading control. Shown is one representative experiment out of two that gave similar results (for gel source data, see Supplementary Figure 1). On the right panel, quantification of BCL6 expression, as assessed by densitometry after normalization for loading control (two-tailed unpaired t-test). b. Sequencing traces of BCL6 PCR amplicons encompassing cell-line specific heterozygous SNPs segregating with the mutant allele, obtained from the 8 clones shown in a. A schematic showing the allelic distribution of the BCL6 SNP, relative to the somatic mutation corrected in each cell line, is provided on the top. Amplicons were generated from DNA (one representative clone shown) and cDNA (n=4 clones/sgRNA). c,d. Immunoblot analysis of BLIMP1, BCL6 and HDAC1 expression in HLY1 (c) and LY18 (d) clones. In LY18, experiments were performed in basal conditions (UT) or upon CD40L stimulation. SUDHL4 is used as negative control for BLIMP1 and positive control for BCL6 expression. * non-specific band (for gel source data, see Supplementary Figure 1). e. Overlap between cases harboring mutations in the BCL6-BLIMP1 binding site (B1BS), BCL6 translocations (Tx), and/or coding mutations in the PRDM1 gene. Data are from 391 DLBCL primary cases analyzed by WGS or Sanger sequencing. f. BCL6 expression levels in DLBCL primary cases stratified based on the genetic lesions indicated in e (n=181 cases with matched WGS and RNA-seq data). Significant differences were calculated by one-way ANOVA with Bonferroni correction. g. Relative distribution of cases harboring the indicated genetic lesions in various DLBCL COO subtypes (two-tailed Fisher’s exact test). The total number of cases analyzed within each subtype is provided on the x-axis label, and the number of mutated cases is shown on the top. h. Mutation harboring the indicated genetic lesions in different LymphGen classes. The total number of cases analyzed is provided on the x-axis label, and the number of mutated cases is shown on the top. A two-tailed Fisher’s exact test was used to determine whether cases carrying the indicated genetic alteration were significantly enriched in a specific LymphGen class versus all other classes combined. Of note, although mutations in BCL6-B1BS can be found at some frequencies in all COO and LymphGen subroups, they were preferentially enriched in the GCB- and ST2 subgroups.
