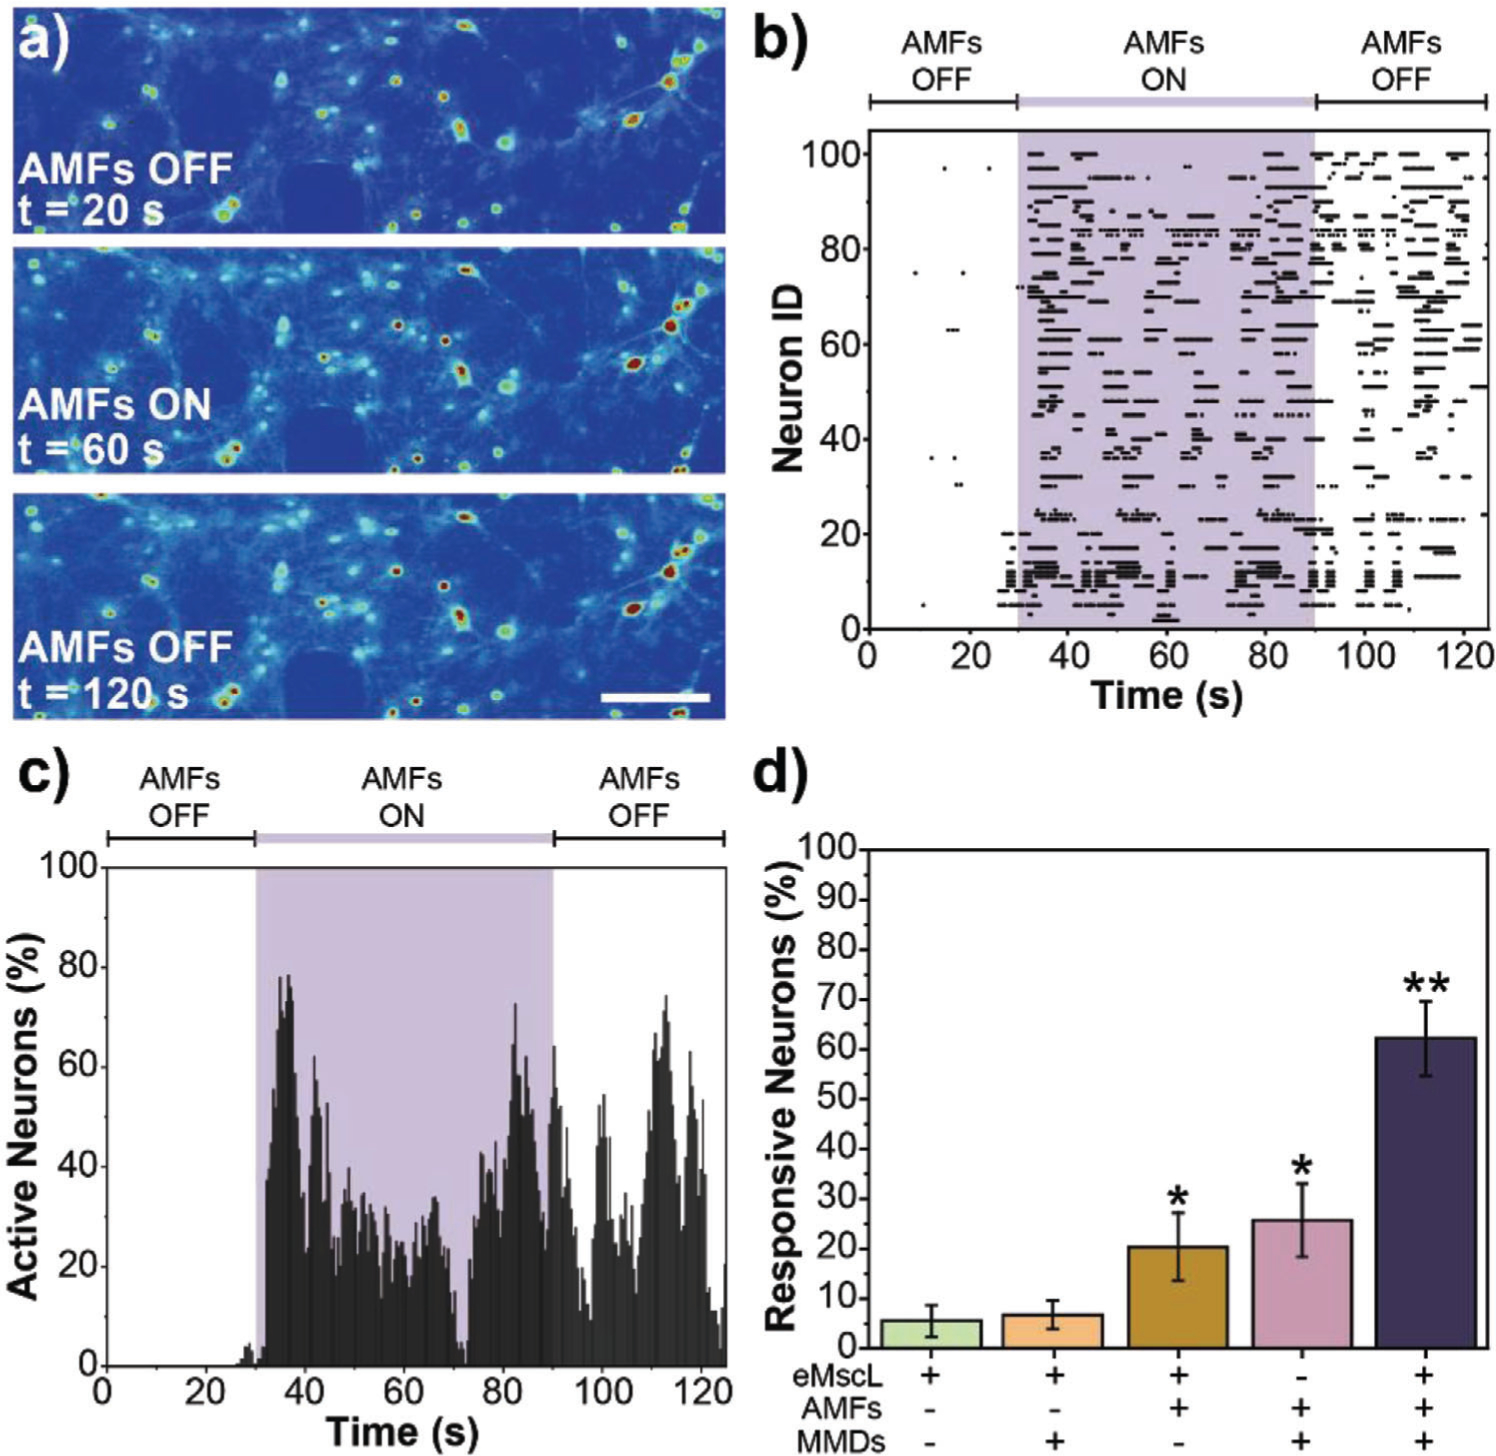
Figure 4.

Force-inducing stimulation of hippocampal neurons mediated by MMDs. a) Calcium fluorescence images from a representative video of hippocampal neurons expressing eMscL and subjected to 1-minute force-inducing stimulation mediated by MMDs at the AMFs conditions of 0.188 kOe and 6 Hz. Scale bar = 50 μm, b) Raster plot tracking the activity of 100 random neurons expressing eMscL, cocultured with MMDs and exposed to AMFs, c) Data from the raster plot normalized to the cell population to represent percentage of active neurons as a function of time. In both, (b) and (c), the purple shadowed area indicates the exposure to AMFs, d) Percent response was determined by dividing the number of neurons that were active during AMFs exposure by the total number of neurons in the field of view. Error bars represent standard deviation (n = 5 samples per condition). ANOVA test was performed to determine statistical significance. * Indicates statistical difference with Negative Control (neurons expressing eMscL in the absence of AMFs and MMDs) and ** indicates statistical difference with both Negative Control and eMscL Control (nontransfected neurons in the presence of AMFs and MMDs) (p-value < 0.05).
