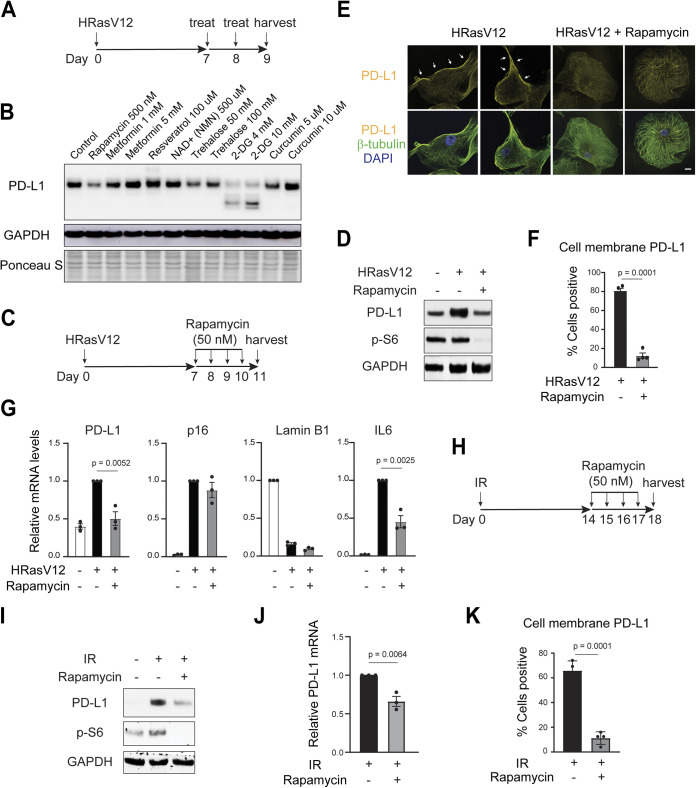
FIG 4.
Rapamycin downregulates PD-L1 of senescent cells. (A) Scheme of experimental plan. Low-passage-number IMR90 cells were infected with retroviral vector encoding HRasV12 to induce senescence. On days 7 and 8, the cells were treated with compounds and were harvested on day 9 for immunoblotting analysis of PD-L1. (B) Effects of compounds on PD-L1 analyzed by immunoblotting. The doses of compounds are indicated in the figure. (C, D) Rapamycin downregulates PD-L1 in senescent IMR90. (C) Scheme of experimental design. Rapamycin at 50 nM was used. (D) Immunoblotting of PD-L1. Phospho-S6 was shown to indicate that rapamycin successfully inhibited mTOR activity. (E) Cells were prepared as in panel C, fixed, and stained with antibodies as indicated, followed by confocal microscopy imaging. The images were acquired under identical settings, and representative images are shown. β-Tubulin was used to label the cells. Bars, 20 μm. Arrows indicate PD-L1 at or near the cell membrane. (F) Quantification of cell membrane-localized PD-L1. The data are from four randomly selected fields with over 200 cells. The results shown are the mean values with SD. The P values were calculated from two-tailed Student’s t test. (G) Cells as in panel C were analyzed by RT-qPCR with indicated primers. The results were normalized to lamin A/C and were presented as mean values with SEM (n = 3). The P values were calculated from two-tailed Student’s t test. (H) Scheme of experimental design. IMR90 cells were challenged with ionizing irradiation (IR, 20 Gy). On day 14, 50 nM rapamycin was added to the media and was replenished daily. The cells were then harvested at day 18 for analyses. (I, J) Cells treated as in panel H were analyzed for PD-L1 by immunoblotting (I) or by RT-qPCR (J). RT-qPCR results were normalized to lamin A/C and were presented as mean values with SEM (n = 3). The P values were calculated from two-tailed Student’s t test. (K) Quantification of cell membrane-localized PD-L1. The data are from four randomly selected fields with over 200 cells. The results shown are mean values with SD. The P values were calculated from two-tailed Student’s t test.

