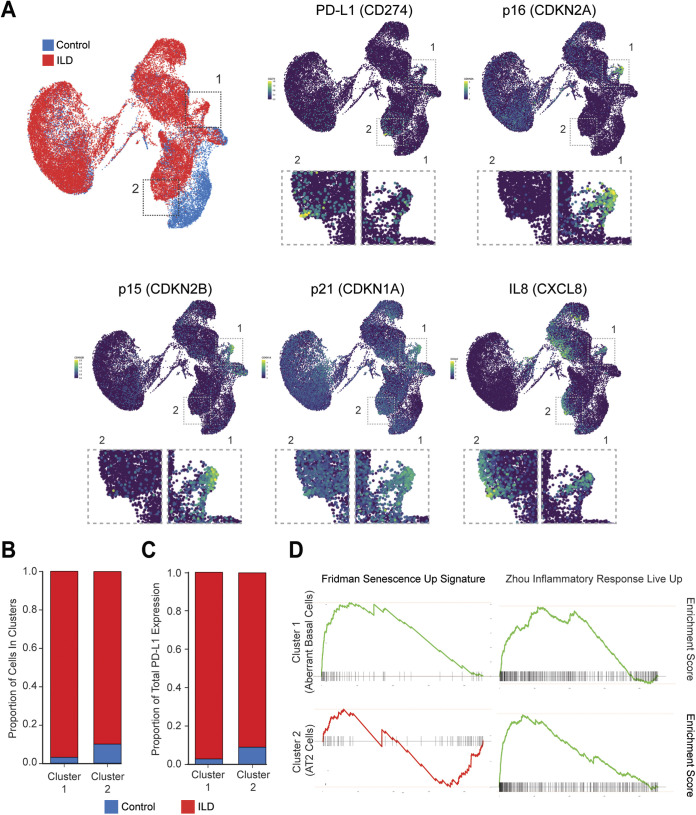
FIG 6.
Upregulation of PD-L1 in interstitial lung disease (ILD). (A) UMAP expression plots of PD-L1 (CD274), p16 (CDKN2A), p15 (CDKN2B), p21 (CDKN1A), and IL-8 (CXCL8) in merged healthy and ILD human lungs. The data were reanalyzed from Habermann et al. (49). Higher-magnification inset panels below each gene expression are shown to highlight PD-L1 high cells. (B) Bar plot showing relative cell number contributions of healthy control donors versus ILD patients to either cluster 1 or 2. (C) Bar plot showing relative contribution to the expression of PD-L1 from healthy control donors versus ILD patients in cluster 1 or 2. (D) GSEA of the cluster 1 (aberrant basal cells) and cluster 2 (AT2 cells) using MSigDB signatures demonstrating that both clusters 1 and 2 are enriched in inflammatory responses (Zhou_Inflammatory_Response_Live_Up), while only cluster 1 is enriched in senescence signatures (Friedman_Senescent_Up).

