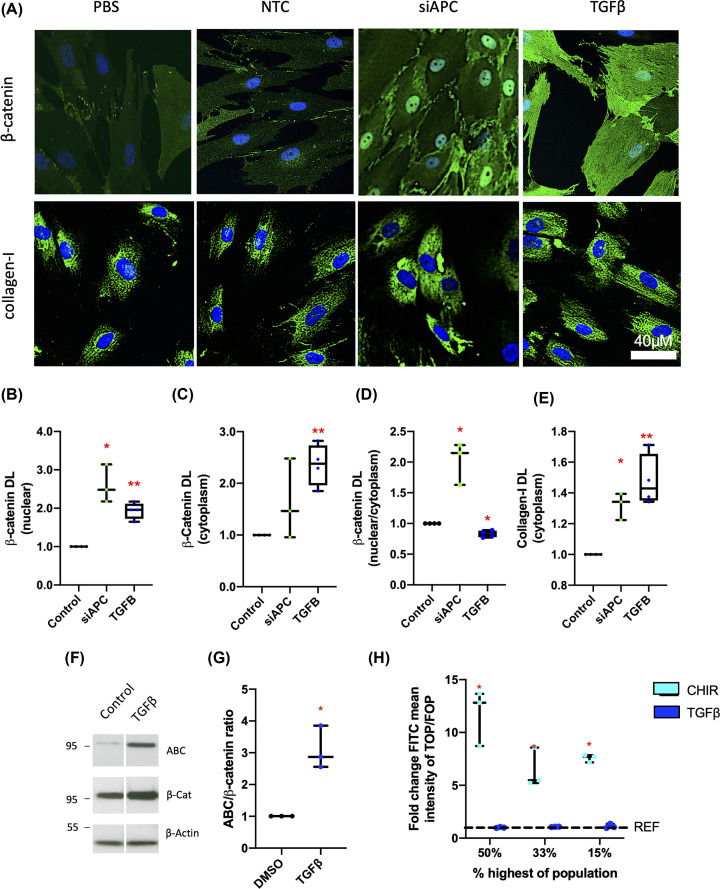
Figure 2. Activation of canonical Wnt β-catenin signalling promotes Collagen-I expression in intestinal fibroblasts in the absence of TGFβ.
(A) Representative IF images of cells stained for DAPI (blue) and β-catenin (green) or Collagen-I (green) 48 h post-transfection with either a negative control siRNA NTC (Cat#1027281) or an APC-targeting siRNA (siAPC, Hs_APC_6 Flexitube, Qiagen, UK, n=3), or treatment with TGFβ (n=4). (B–D) The levels of nuclear β-catenin, cytoplasmic β-catenin levels, as well as the cytoplasmic:nuclear ratio of β-catenin were quantified from IF images. (E) Cytosolic Collagen-I protein levels were also calculated for all treatment groups. (F,G) Representative western blots for activated (dephosphorylated) β-catenin (ABC), total β-catenin, and the loading control β-Actin, along with graphical representation of active:total β-catenin ratio, in CCD-18Co cells treated with TGFβ. (H) Results of TOP/FOP assays in CCD-18Co cells treated with TGFβ or the positive control CHIR-99021 (CT99021), a GSK-3 inhibitor, are presented (n=3). FITC mean intensity for TOP- and FOP-transduced cells was determined and the TOP/FOP ratio given as a fold-change relative to vehicle control; DL = density levels. Differences between treatments were determined by a paired t-test to account for different cell passages. In general, data are presented as fold-changes with panels B–E, G, and H as box plots showing 25th to 75th percentiles, median (horizontal bar), and the smallest and largest value (whiskers). Significant results relative to control are indicated by * symbol (*<0.05, **<0.01, ***<0.001).

