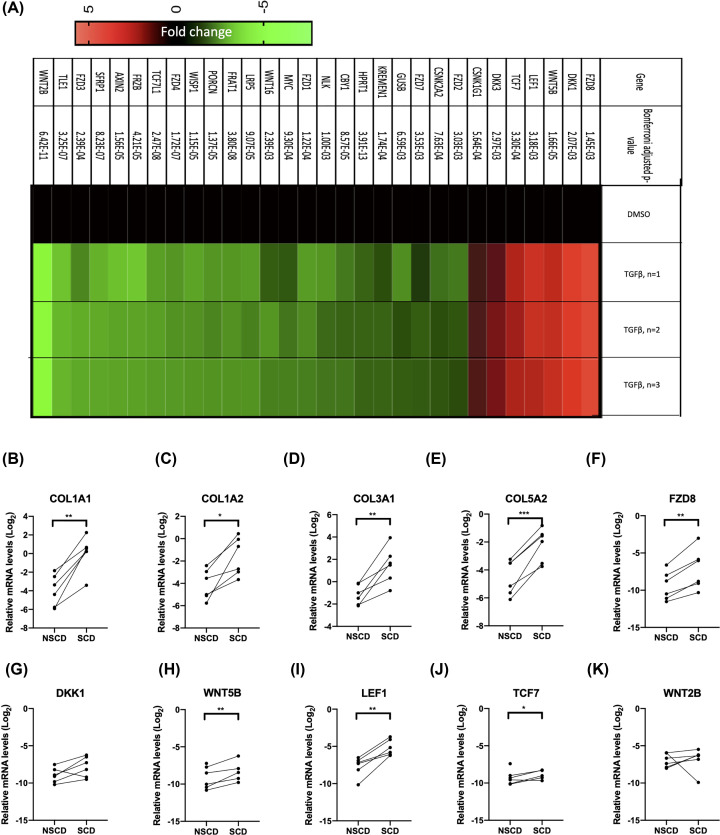
Figure 3. TGFβ increased the expression of FZD8, which is required for TGFβ-mediated up-regulation of Collagen-I.
(A) Genes regulated by TGFβ in the Wnt signalling pathway were identified using a targeted qPCR profiling array (n=3) and the data are presented as a heatmap and P-values are presented in the figure. The relative fold-change in gene expression in TGFβ-treated cells is given for each of the three replicates. Differences between treatments were determined by t-test and corrected for multiple testing. (B–K) qPCR quantification of selected collagen and TGFβ-regulated genes in the Wnt-signalling pathway from RNA isolated from the mucosa overlying SCD and patient-matched NSCD intestine (n=6). The mRNA levels are normalised to the house-keeping gene RPLPO. Differences between treatments were determined by a paired t-test to account for different cell passages. In general, data are presented as fold-changes with panels C–J as box plots showing 25th to 75th percentiles, median (horizontal bar), and the smallest and largest value (whiskers). Significant results relative to control are indicated by * symbol (*<0.05, **<0.01, ***<0.001). A bar indicates specific statistical comparisons.

