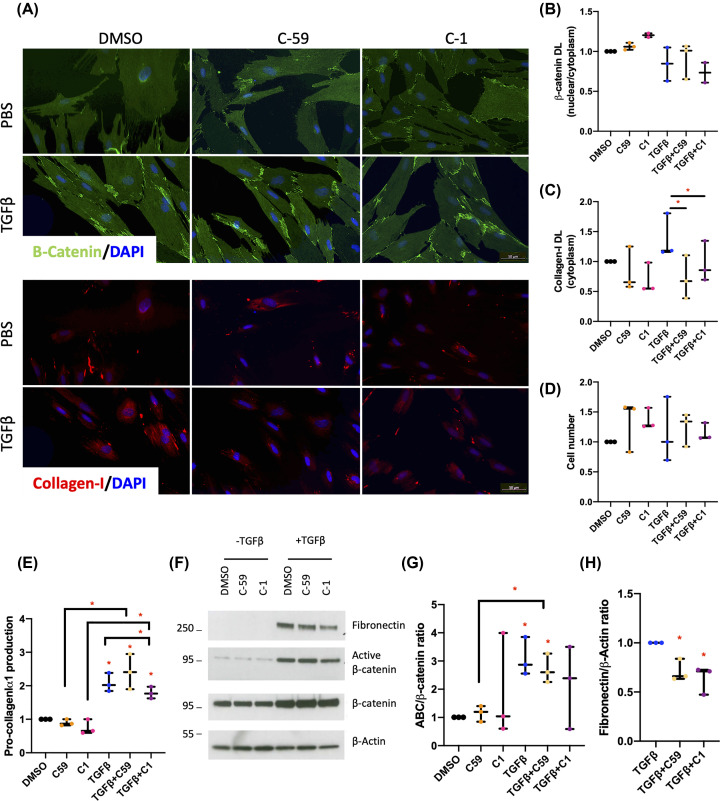
Figure 4. Small-molecule Wnt inhibitors of FZD8 and Wnt5B inhibit Collagen-I expression in intestinal fibroblasts.
(A) β-catenin and Collagen-I protein levels were also determined by IF in treated CCD-18Co cells with Wnt-C59 (C59), 3235-0367 (C1), or the vehicle control (DMSO) in combination with TGFβ. Representative images are provided. (B) β-catenin levels are presented as a ratio of the nuclear:cytoplasmic levels of the protein (n=2). (C,D) Cytosolic Collagen-I levels are also provided (n=3), along with cell counts for each treatment (n=3). (E) Pro-Collagen-Iα1 levels in the media were determined by ELISA (n=3). (F) Representative western blot showing the effects of 48 h of treatments on Fibronectin, dephosphorylated ABC levels, and total β-catenin protein levels. (G) β-catenin protein levels are presented as a ratio of ABC:β-catenin as determined by quantification of the IF images (n=3). (H) Fibronectin levels are expressed normalised to the loading control (β-Actin); DL = density levels. Differences between treatments were determined by a paired t-test to account for different cell passages. In general, data are presented as fold-changes with panels B–E, G, and H as box plots showing 25th to 75th percentiles, median (horizontal bar), and the smallest and largest value (whiskers). Significant results relative to control are indicated by * symbol (*<0.05, **<0.01, ***<0.001). A bar indicates specific statistical comparisons.

