Figure 2.
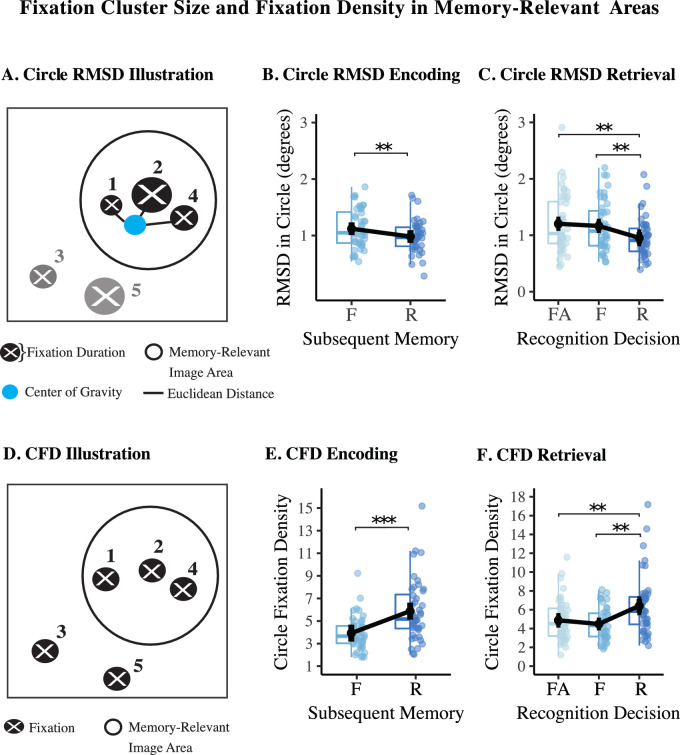
Fixation cluster and circle fixation density. Points correspond to single subjects, black dots and error bars represent the mean and within-subjects standard error, boxplots represent the underlying distribution. (A) Circle RMSD Illustration, exemplifying the average Euclidean distance between fixations and its center of mass of fixations within the circle area, weighted by fixation duration. (B) Circle RMSD between subsequently recollected versus familiar scenes. (C) Circle RMSD between recollected versus familiar versus falsely recognized scenes. (D) CFD illustration, the proportion of fixations within the circle relative to all fixations on the image are corrected by the size of the circle on the image. (E) CFD between subsequently recollected versus familiar scenes. (F) CFD between recollected versus familiar versus falsely recognized scenes. F, familiar; FA, false alarm; R, recollected. ***p < .001, **p < .01.

