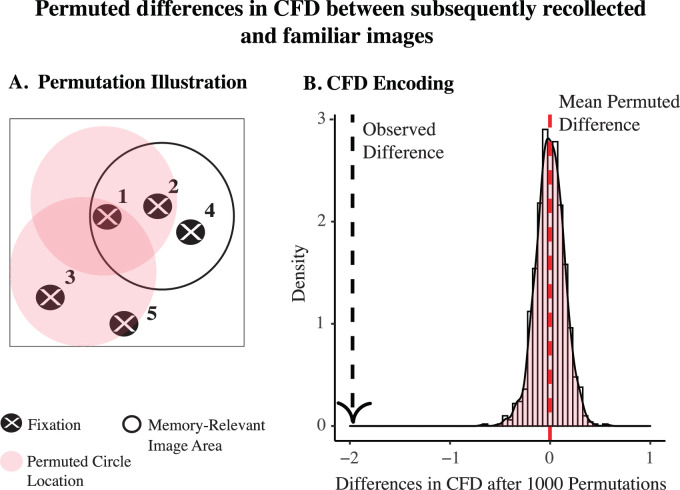
Figure 3.
CFD permutation test. (A) Permutation illustration. The circle location is shuffled across trials on a single-subject level. (B) Permutation test CFD at encoding. The distribution of estimated mean differences between subsequently recollected versus familiar CFDs under the null hypothesis. Our observed difference falls on the extreme left tail of the distribution, p < 0.001.

