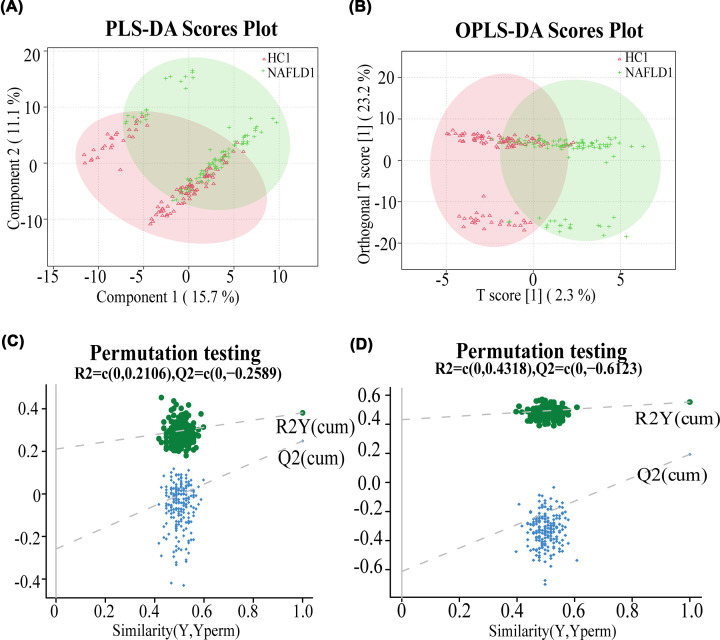
Figure 2. The composition of serum metabolites was different between the two groups.
The PLS-DA (A) and OPLS-DA (B) scores plot of NAFLD1 (green) and HC1 (red) groups. (C) The permutation test plot validated the reliability of the PLS-DA model. (D) The permutation test plot showed the OPLS-DA model was valid and not overfit; HC, healthy controls; NAFLD, nonalcoholic fatty liver disease patients; OPLS-DA, orthogonal partial least square discriminant analysis; PLS-DA, partial least squares discrimination analysis.

