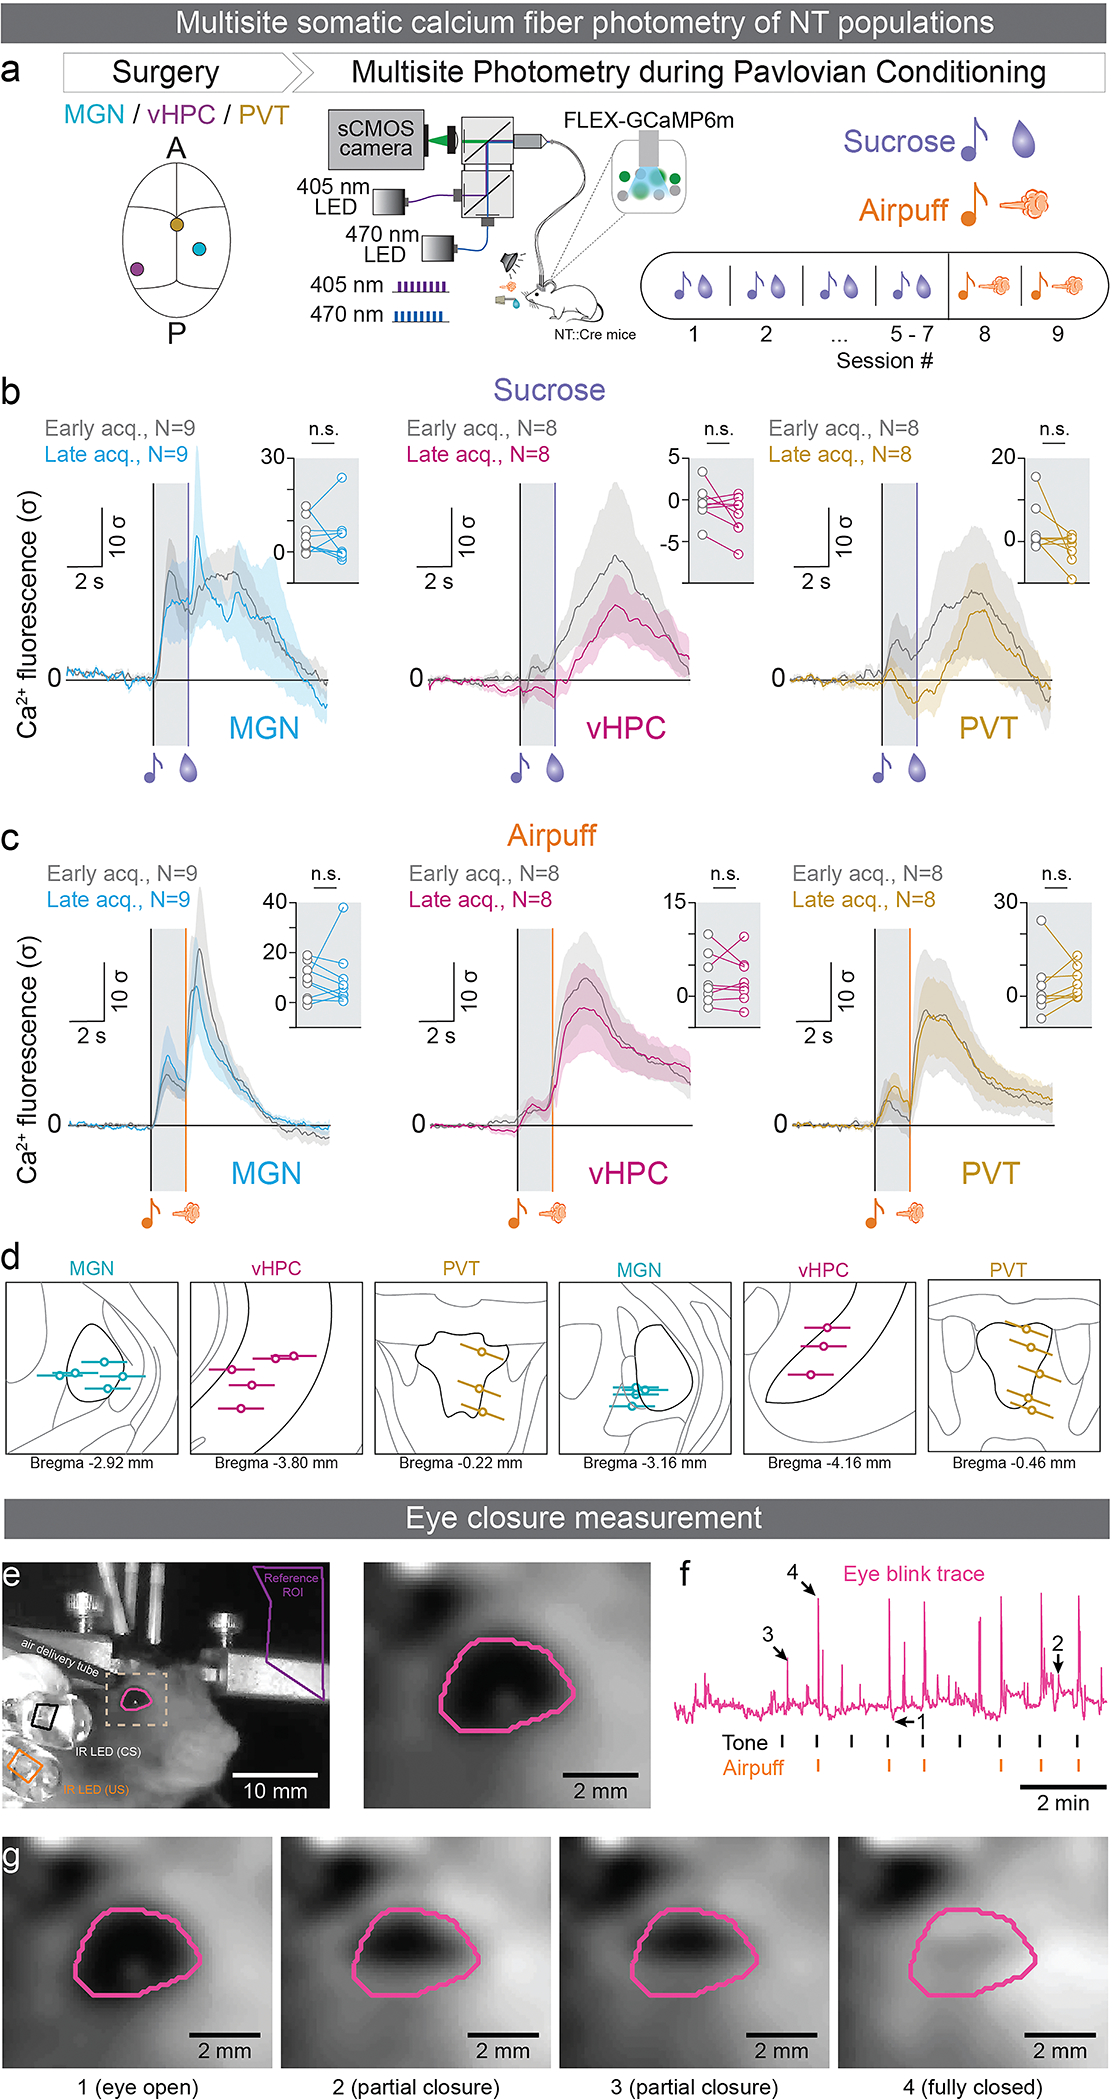
Extended Data Figure 6: Multisite photometry recordings of NT populations in the MGN, the PVT, and the vHPC.

a: Experimental design for assaying neural activity from the MGN, the vHPC and the PVT:NT populations during reward and punishment associations. A virus expressing the genetically encoded calcium indicator GCaMP6m under the control of Cre was injected into the MGN, the vHPC and the PVT of NT::Cre mice. A sketch of the top-down view of the mouse skull depicting placement positions for viral injections and optic fibers is shown on the left. Upon viral incubation for at least 8 weeks, mice learned to associate a tone with sucrose reward over 5–7 sessions, and a different tone with airpuff over two sessions (right) in a head-fixed preparation while calcium activity from NT populations was being recorded using a multi-site photometry system depicted in the middle.
b-c: Population averages of z-scored Ca2+ fluorescence responses during early and late acquisition of anticipatory lick behavior (b) or anticipatory eye blink behavior (c) from the NT populations in the MGN (left), the vHPC (middle) and the PVT (right). Insets compare area under the curve during early and late acquisition from the onset of the CS to the onset of the US (light gray shaded region) during tone-sucrose association (b; paired t-tests, two-tailed, t8=0.3214, P=0.7561, effect size= −0.7986 ± 2.484, CI95= −6.528 to 4.931 for MGN, t7=1.615, P=0.1504, effect size= −1.444 ± 0.894, CI95= −3.558 to 0.6703 for vHPC, t7=1.76, P=0.1218, effect size= −4.543 ± 2.581, CI95= −10.65 to 1.56 for PVT), or tone-airpuff association (c; paired t-tests, two-tailed, t8=0.2102, P=0.8388, effect size=0.7795 ± 3.709, CI95= −7.774 to 9.333 for MGN; t7=0.1973, P=0.8492, effect size= −0.1977 ± 1.002, CI95= −2.567 to 2.172 for vHPC; and t7=0.5676, P=0.588, effect size= 1.456 ± 2.564, CI95= −4.608 to 7.519 for PVT).
d: Representation of fiber placements in all mice. Placements are indicated on outlines in the coronal plane, and the numbers below indicate distance from bregma.
e-g: Mice were head-fixed and pressurized air (20 psi) was delivered through a tube directly onto their eye for 0.1 s. The video frames were synchronized to the behavior data using two infra-red (IR) light emitting diodes (LEDs), one to indicate the CS tone, and the other to indicate the open state of the solenoid valve gating the air delivery. (e) Regions of interest (ROI) were drawn around the CS and US LEDs, and the average pixel intensities in the ROI were thresholded to identify the CS and US onset frames. An ROI encompassing the eye of the mouse was drawn (pink), and each frame was smoothed using a Gaussian filter. (f) The average intensity of all the pixels within the eye ROI was used as a metric for the size of the eye. (g) To control for background changes in intensity, the reference ROI time course was regressed from the eye ROI time course. A post-Gaussian smoothed frame of the region around the eye (dotted line) is shown on the right. Distances were calibrated using the size of the right screw that holds the head bar.
N denotes number of mice in each group. Solid shaded regions around the mean indicate s.e.m.
