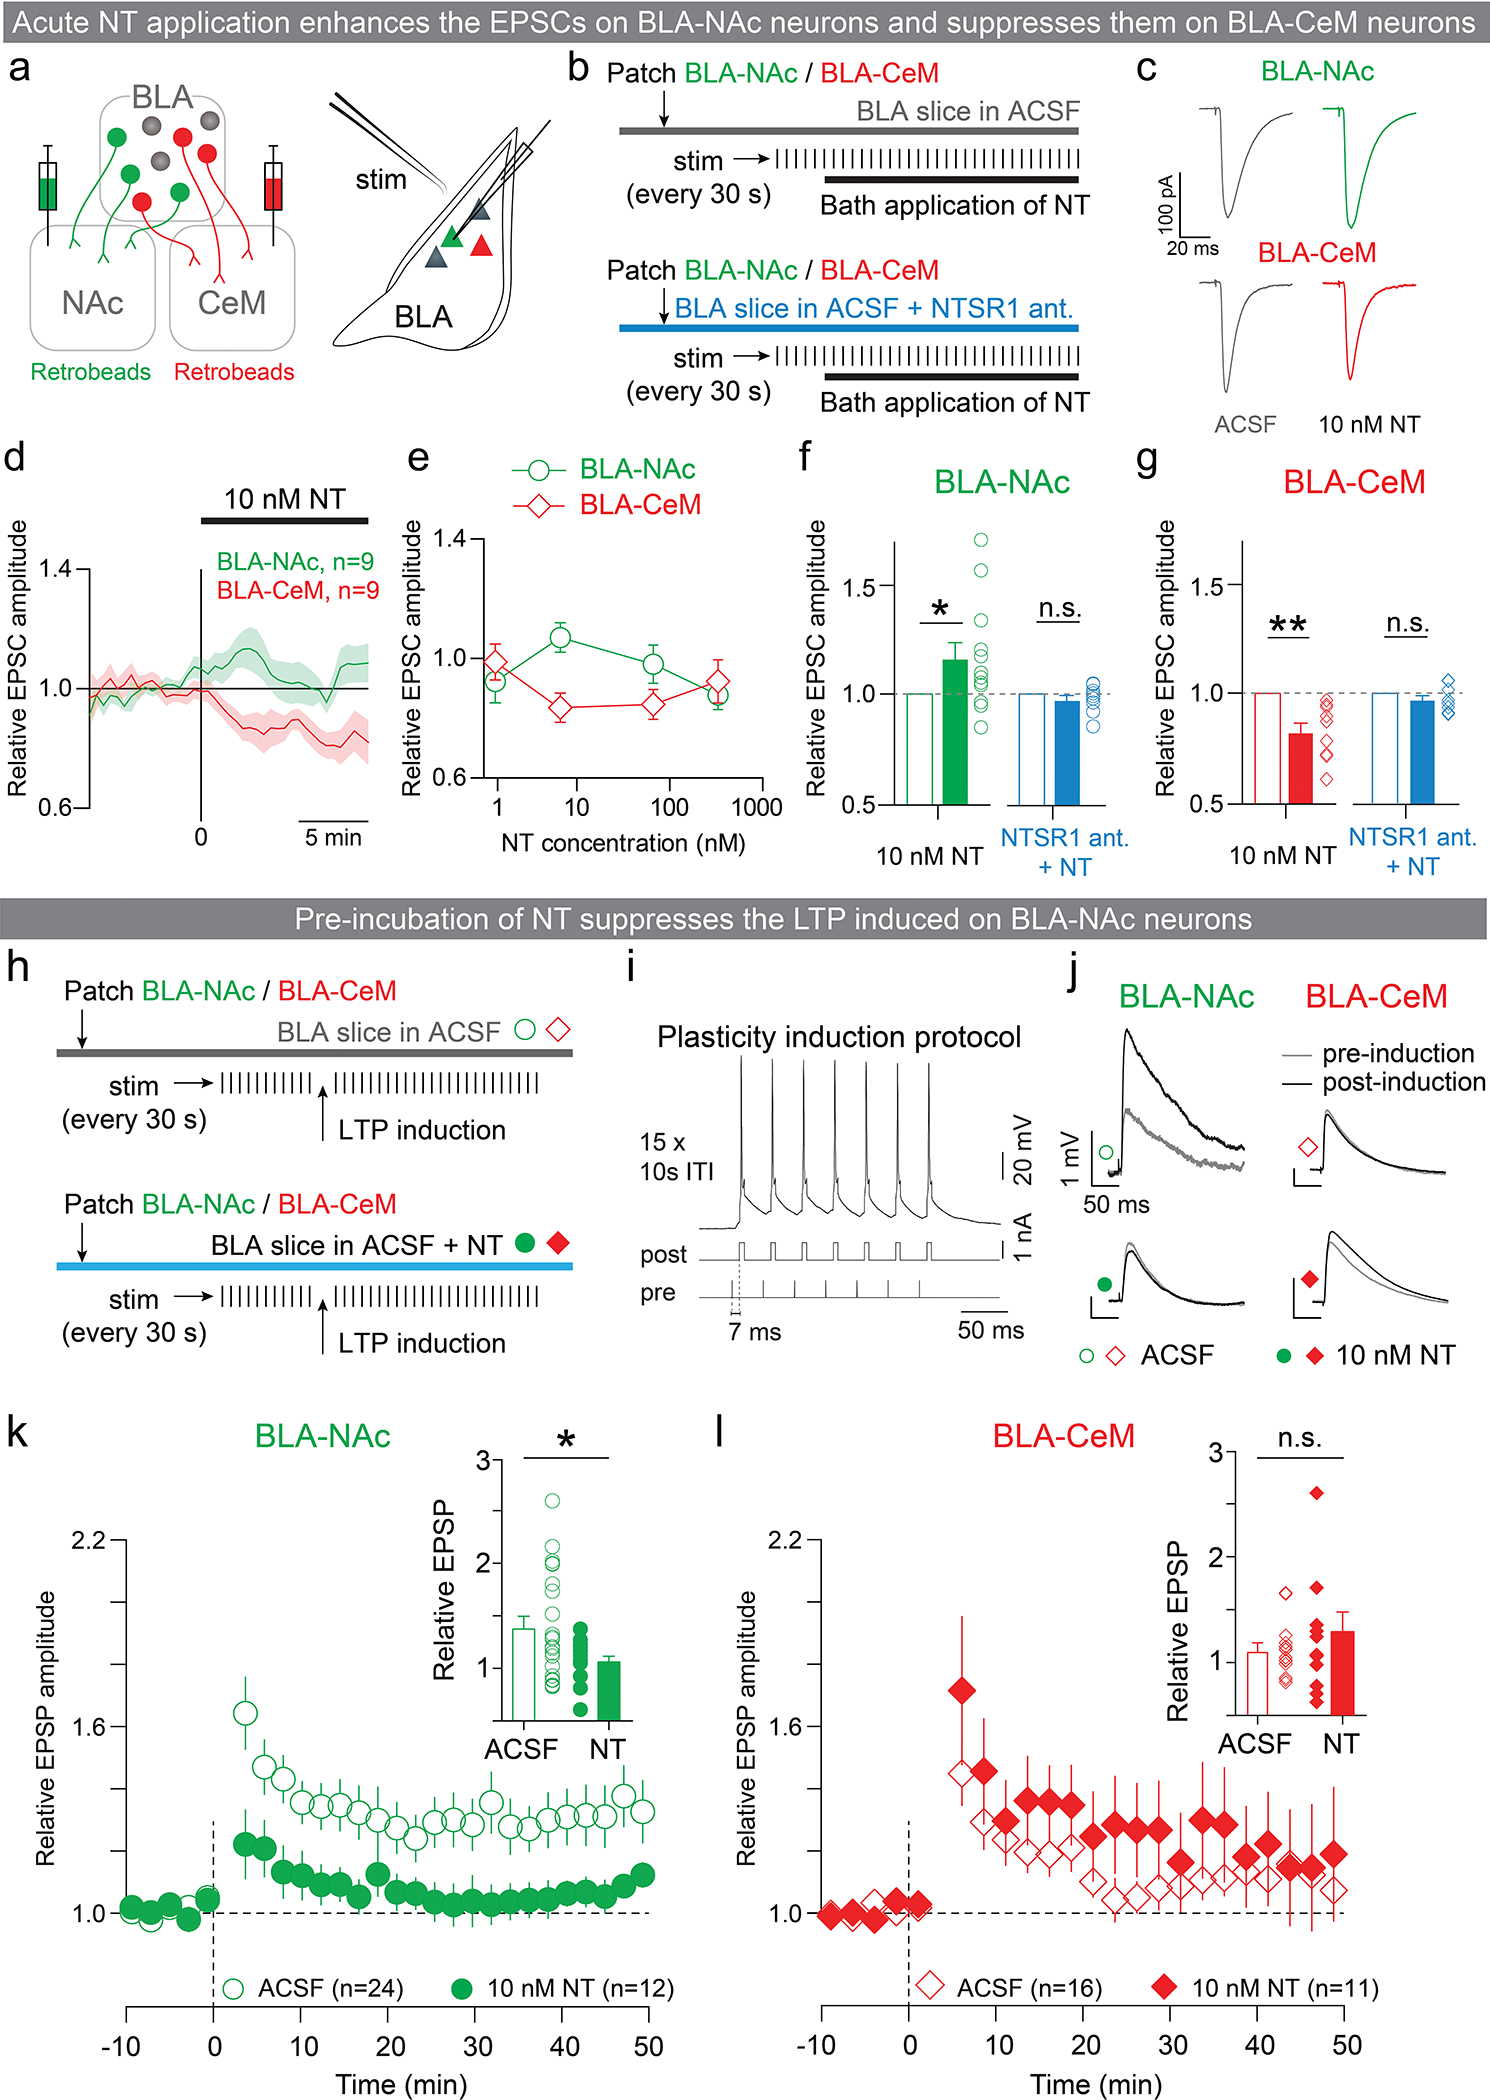
Extended Data Figure 9: Acute and pre-incubation of NT applications produce distinct synaptic effects on BLA neurons.

a-g: Phasic NT application enhanced EPSCs on BLA-NAc neurons and suppressed it on BLA-CeM neurons. (a) Experimental design for recording from BLA-NAc or BLA-CeM neurons ex vivo. About two weeks after injecting retrobeads into the NAc and CeM, BLA-NAc or BLA-CeM neurons were targeted in acute slices using fluorescence from the retrobeads. EPSCs evoked by internal capsule stimulation were assayed from these neurons. (b) EPSCs were assayed every 30 s during voltage clamp recordings. Once the EPSC amplitude stabilized, NT was applied to the bath. EPSC modulation of NT was assessed by the ratio of amplitudes of EPSCs after and before the bath application of NT. (c) Average EPSCs from representative BLA-NAc and BLA-CeM neurons before (gray; left column) and after (right column) the bath application of NT. (d) Average relative EPSC amplitude time course for BLA-NAc and BLA-CeM populations for a concentration of 10 nM NT in the bath. (e) Relative EPSC amplitudes of BLA-NAc and BLA-CeM neurons for different concentrations of NT (2, 10, 100 and 500 nM). (f-g) At a concentration of 10 nM, NT significantly enhanced EPSCs in BLA-NAc neurons and suppressed EPSCs in BLA-CeM neurons (Wilcoxon signed-rank test, NT: **P=0.0039, W=−45, n=9, sum of positive and negative ranks=0 and −45. NTSR1: P=0.0781, W=−26, n=8, sum of positive and negative ranks=5 and −31). Differential EPSC modulation by NT was abolished when the slices were bathed in NTSR1 antagonist (Wilcoxon signed-rank test, NT: *P=0.0425, W=52, n=12, sum of positive and negative ranks=65 and −13; NTSR1: P=0.4961, W=−13, n=9, sum of positive and negative ranks=16 and −29).
h-l: Pre-incubation of NT suppressed LTP induced on BLA-NAc neurons. (h) Schematics of LTP induction protocol. (i) Spike timing dependent plasticity induction protocol: each pulse in a 10 pulse, 30 Hz stimulus train delivered through a bipolar stimulating electrode to the internal capsule was followed after 7 ms by a 5 ms, 1 nA current pulse delivered directly to the recorded cell in the BLA through the recording electrode. This protocol was repeated 15 times with a 10 second inter-trial interval, and reliably induced spiking in recorded neurons. (j) EPSP traces from representative BLA-NAc and BLA-CeM neurons before (gray traces) and after (black traces) LTP induction. (k-l) STDP-induced LTP in the presence of NT (10 nM) 10–50 minutes after induction was reduced in BLA-NAc neurons, but unchanged in BLA-CeM neurons compared with the ACSF control (unpaired t-test, k, Unpaired t-test, t31=2.177, *P=0.0367, effect size=−0.3355 ± 0.1541, CI95=−0.649 to −0.022. l, Unpaired t-test, t25=1.193, P=0.2442, effect size=0.1795 ± 0.1505, CI95=−0.1305 to 0.4896).
n denotes number of neurons in each group. Error bars and shaded regions around the mean indicate s.e.m.
